A few days ago, a group friend took over a piece of ancestral code. The investigation has not been solved for a long time. He is ready to take the bucket and run away, and finally help him solve it. For the complete process, see https://mengkang.net/1470.html but the final code location I have some based on personal experience that the actual calling link is different from what I expected. It is all based on guessing. I didn't see the complete call chain, so I thought I needed a tool to assist in the clear query of the entire call chain.
160d42d851e520 so I made such a tool, mainly for some unfamiliar projects, and the daily environment is not
deliverer Ancestral Code https://github.com/zhoumengkang/deliverer
If your project is not that bad and the daily environment is ok, then the best way to get familiar with a project is xdebug. This tool is mainly to troubleshoot online problems.
Similar tools are 360's phptrace. The implementation principle is slightly different.
function points
can be filtered according to 160d42d851e68b function name,class name,method name,route- You can exit after querying the specified filtering content n times
- You can take a closer look at the entire call chain according to the request id playback
- The filtered content will be highlighted
- If the call stack is deeper, you can specify -l to hide the display of deep calls
principle
In fact, it is relatively simple, divided into two steps, the first step is to collect logs, and the second step is to analyze the logs.
first step
In PHP_MINIT stage, by zend_set_user_opcode_handler to set ZEND_DO_UCALL , ZEND_DO_FCALL_BY_NAME , ZEND_DO_FCALL three opcode processing and analysis.
Note that it will cover some built-in functions and method calls, and we can filter by type.
Then create a new log file in the PHP_RINIT stage and write the requested information
pid-ts sapi http_method http_urlPrint the call stack information in the custom handler during the request
Finally, close the log file writing PHP_RSHUTDOWN
Second step
bin/deliverer to analyze and sort the collected logs. This is a php script, so I won’t go into details.
Install and use
Compile
$ phpize
$ ./configure --with-php-config=/usr/local/php/bin/php-config
$ make && sudo make install
Configure php.ini
Append
[deliverer]
extension=deliverer.so
Restart php-fpm
sudo service php-fpm restartUse analysis tools
You can move ./bin/deliverer to the directory you think is appropriate, if in the current directory
$ chmod +x delivererRun with a piece of my own ancestral code long ago (my blog)
$ ./bin/deliverer -tThis will always monitor the execution of all php processes
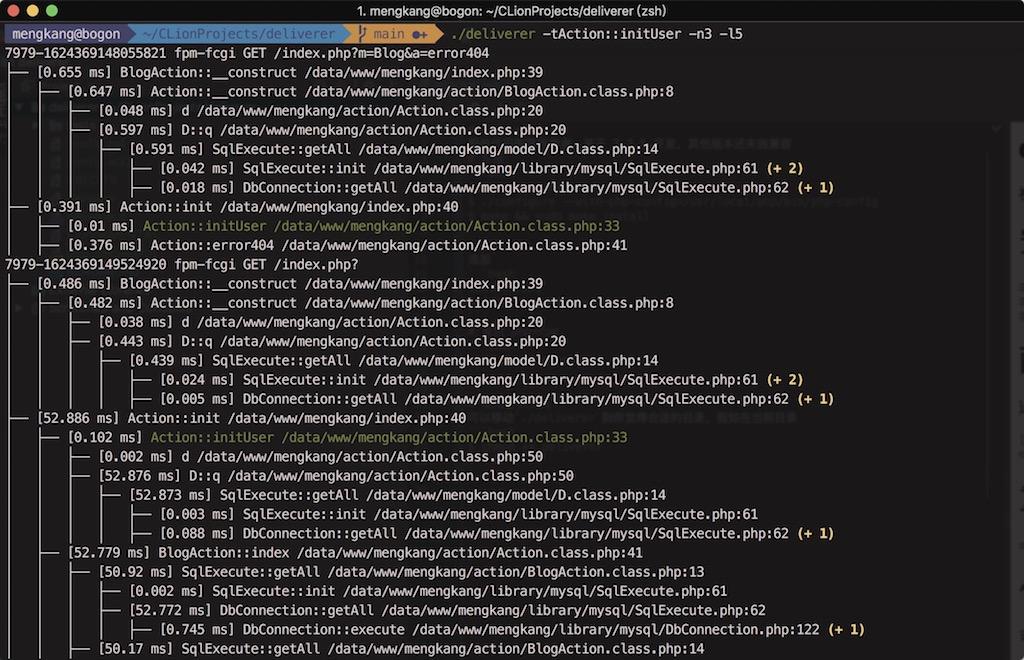
$ ./bin/deliverer -tAction::initUser -n3 -l5| parameter | value | Explanation |
|---|---|---|
| -t | Action::initUser | Filter the requests that contain the call |
| -n | 3 | Count three times and then exit |
| -l | 5 | Function (method) call depth display, up to 5 levels are displayed, the excess part is marked at the end |
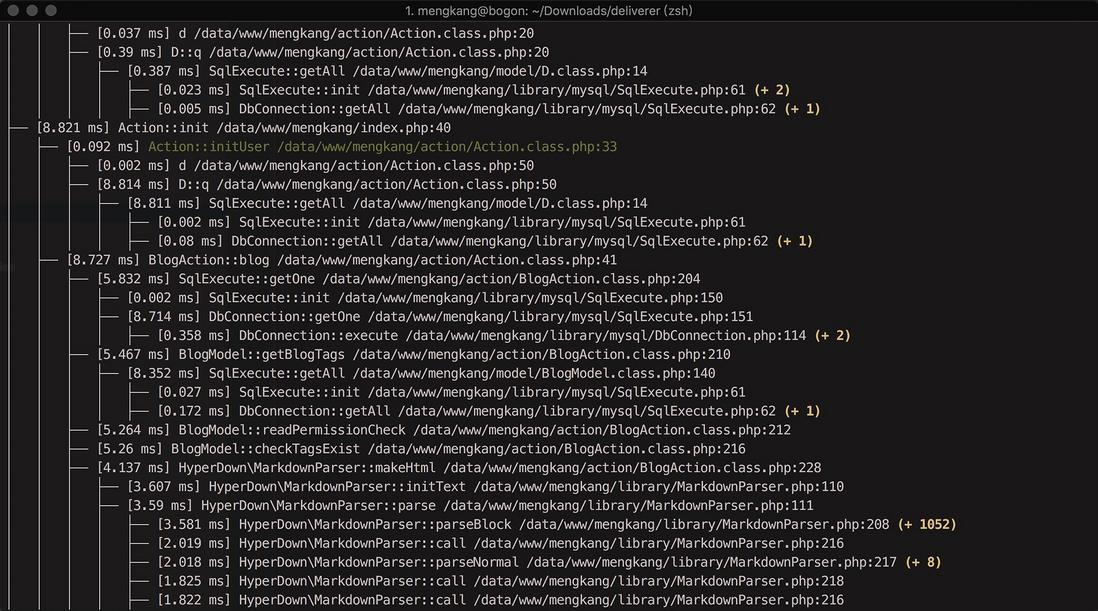
$ ./bin/deliverer -v7979-1624369150991941View the complete call stack in detail through -v requestId
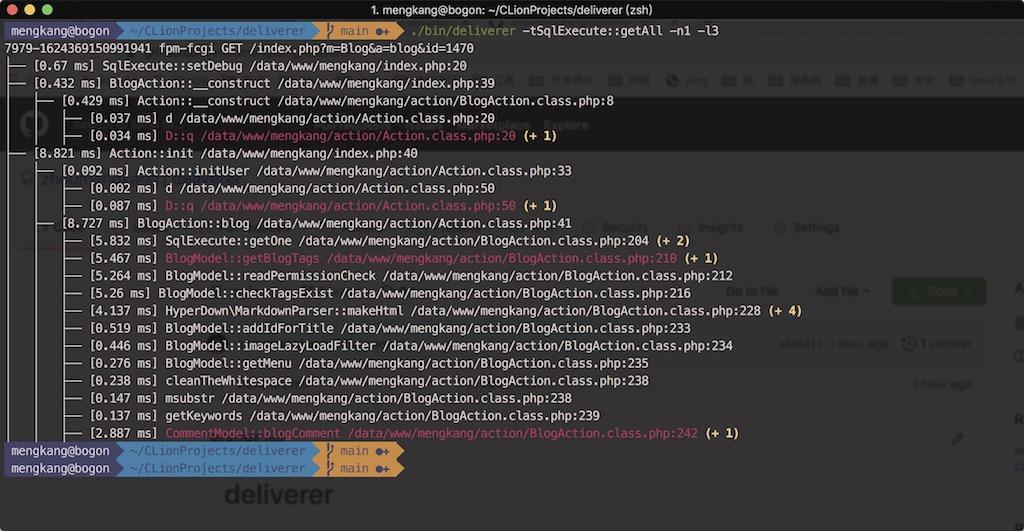
$ ./bin/deliverer -tSqlExecute::getAll -n1 -l3When a method is to be queried, the function call stack is too deep and not within the scope of the hierarchical query, the outer call is displayed in red


**粗体** _斜体_ [链接](http://example.com) `代码` - 列表 > 引用。你还可以使用@来通知其他用户。