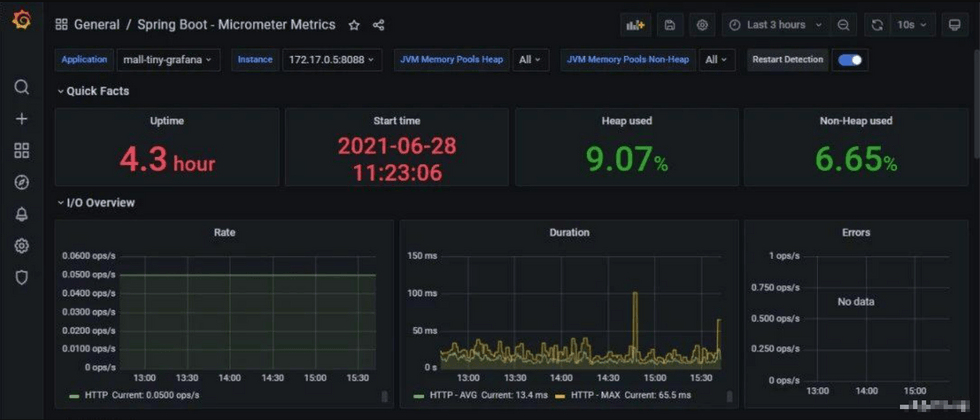
When faced with a complex system, we often need monitoring tools to help us solve some performance problems. For example, we usedSpringBoot Adminto monitor the application before to obtain the index information exposed bySpringBoot ActuatorToday, I will introduce you to Grafana, a powerful monitoring tool. As long as you need to use it for monitoring, use it for visualization!
SpringBoot actual combat e-commerce project mall (50k+star) address: https://github.com/macrozheng/mall
Introduction to Grafana
Grafana is an open source data visualization and analysis tool. No matter where your indicator information is stored, you can use it to visualize the data. At the same time, it also has an alarm function, which will alert you when the indicator exceeds the specified range.
Introduction to Prometheus
Prometheus is a time series database, which can be simply understood as a MySQL database with time. Since Grafana can only convert data into visual charts and has no storage function, we need to use it in conjunction with a time series database such as Prometheus.
installation
Using Docker to install Grafana and Prometheus is undoubtedly the easiest, we will use this method next.
- First download Grafana's Docker image;
docker pull grafana/grafana- Run Grafana after the download is complete;
docker run -p 3000:3000 --name grafana \
-d grafana/grafana- Next download the Docker image of Prometheus;
docker pull prom/prometheus- Create Prometheus configuration file
prometheus.ymlin the/mydata/prometheus/directory:
global:
scrape_interval: 5s- Run Prometheus and
prometheus.ymlin the host to the container;
docker run -p 9090:9090 --name prometheus \
-v /mydata/prometheus/prometheus.yml:/etc/prometheus/prometheus.yml \
-d prom/prometheus- At this point, the installation is complete, is it very simple! Grafana can be accessed through the following address, the login account password is
admin:admin, and the access address: http://192.168.5.78:3000/
- After logging in to Grafana, the display interface is as follows;
- In fact, Prometheus also has a visual interface, which is a bit crude. The access address: http://192.168.5.78:9090/
use
After Grafana has been installed, it's time to come to practice in Poland. Next, let's introduce the use of Grafana to monitor Linux systems and SpringBoot applications.
Monitoring system information
Using node_explorer can expose the indicator information of the Linux system, and then Prometheus can obtain and store the indicator information through regular scanning.- Download the installation package of
node_explorerhttps://prometheus.io/download/#node_exporter
- This time we directly install
node_exploreron the Linux server (if using Docker container installation, the monitoring will be the indicator information of the Docker container), unzip the downloaded installation package to the specified directory, and modify the folder name:
cd /mydata
tar -zxvf node_exporter-1.1.2.linux-amd64.tar.gz
mv node_exporter-1.1.2.linux-amd64 node_exporter- Enter the decompression directory, use the following command to run
node_explorer, the service will run on port9100
cd node_exporter
./node_exporter >log.file 2>&1 &- Use the
curlcommand to access the interface for obtaining indicator information, and the information obtained indicates that the operation is successful;
curl http://localhost:9100/metrics# HELP promhttp_metric_handler_requests_in_flight Current number of scrapes being served.
# TYPE promhttp_metric_handler_requests_in_flight gauge
promhttp_metric_handler_requests_in_flight 1
# HELP promhttp_metric_handler_requests_total Total number of scrapes by HTTP status code.
# TYPE promhttp_metric_handler_requests_total counter
promhttp_metric_handler_requests_total{code="200"} 2175
promhttp_metric_handler_requests_total{code="500"} 0
promhttp_metric_handler_requests_total{code="503"} 0- Next, modify the Prometheus configuration file
prometheus.yml, and create a task to scan the index information exposed bynode_explorer
scrape_configs:
  - job_name: node
    static_configs:
- targets: ['192.168.5.78:9100']- Restart the Prometheus container, you can create a dashboard
plus sign -> Dashboard;
- Of course, you can also choose to download a Dashboard from Grafana's dashboard market, the market address: https://grafana.com/grafana/dashboards
- Here I chose the
Node Exporter Full, remember its ID, access address: https://grafana.com/grafana/dashboards/1860
- Select Import Dashboard and enter the ID, and finally click
Load;
- Select the data source as Prometheus, and finally click
Import;
- After the import is successful, you can see the real-time monitoring information in Grafana, is it cool enough?
Monitor SpringBoot applications
Monitoring SpringBoot applications needs to rely onactuatorandmicrometer. By exposingactuator, Prometheus can periodically obtain and store indicator information.
- Modify the
pom.xmlfile of theactuatorandmicrometerdependencies;
<dependencies>
    <dependency>
        <groupId>org.springframework.boot</groupId>
        <artifactId>spring-boot-starter-actuator</artifactId>
    </dependency>
    <!-- 集成micrometer,将监控数据存储到prometheus -->
    <dependency>
        <groupId>io.micrometer</groupId>
        <artifactId>micrometer-registry-prometheus</artifactId>
    </dependency>
</dependencies>- Modify the application configuration file
application.yml, byactuatorexposure monitoring port/actuator/prometheus;
management:
  endpoints:
    web:
      exposure:
        # 暴露端点`/actuator/prometheus`
        include: 'prometheus'
  metrics:
    tags:
application: ${spring.application.name}- Before monitoring the SpringBoot application, we need to run a SpringBoot application first, and run it with the following command;
docker run -p 8088:8088 --name mall-tiny-grafana \
-v /etc/localtime:/etc/localtime \
-v /mydata/app/mall-tiny-grafana/logs:/var/logs \
-e TZ="Asia/Shanghai" \
-d mall-tiny/mall-tiny-grafana:1.0-SNAPSHOT- Modify the configuration file
prometheus.ymlPrometheus and create a task to periodically scanactuator. It should be noted here that since the SpringBoot application runs in a Docker container, you need to usedocker inspect mall-tiny-grafana |grep IPAddressto obtain the container IP address;
scrape_configs:
  # 采集任务名称
  - job_name: 'mall-tiny-grafana'
    # 采集时间间隔
    scrape_interval: 5s
    # 采集超时时间
    scrape_timeout: 10s
    # 采集数据路径
    metrics_path: '/actuator/prometheus'
    # 采集服务的地址
    static_configs:
- targets: ['172.17.0.5:8088']- We can determine whether Prometheus can obtain indicator information through the visual interface of Prometheus;
- Similarly, we can import dashboards from the dashboard market, visit the address: https://grafana.com/grafana/dashboards/14370
- After the import is successful, you can see the SpringBoot real-time monitoring information in Grafana, which is really cool!
to sum up
Through a wave of practice of Grafana, we can find that the process of using Grafana to visualize data is as follows: first we have to let the monitored party expose the indicator information, then use Prometheus to obtain and store the indicator information at regular intervals, and finally add Prometheus Configured as a visual data source for Grafana.
Reference
- Grafana official document: https://grafana.com/docs/grafana/latest/getting-started/getting-started-prometheus/
- Use of node-exporter: https://prometheus.io/docs/guides/node-exporter/
Project source code address
https://github.com/macrozheng/mall-learning/tree/master/mall-tiny-grafana
This article GitHub https://github.com/macrozheng/mall-learning has been included, welcome to Star!


**粗体** _斜体_ [链接](http://example.com) `代码` - 列表 > 引用。你还可以使用@来通知其他用户。