
The log collection scheme that I have been using before is ELK, which often takes up several gigabytes of memory, and some poorly configured servers are a bit unbearable! Recently discovered a set of lightweight log collection scheme: Loki+Promtail+Grafana (LPG for short), a few hundred M of memory is enough, and the interface is also quite good, I recommend it to everyone!
SpringBoot actual combat e-commerce project mall (50k+star) address: https://github.com/macrozheng/mall
Introduction
The LPG log collection solution occupies very little memory, is economical and efficient! It does not index logs like the ELK log system, but sets a set of tags for each log stream. Here are its core components:
- Promtail: Log collector, a bit like Filebeat, can collect logs in log files and push the collected data to Loki.
- Loki: Aggregate and store log data, which can be used as a data source for Grafana to provide visual data for Grafana.
- Grafana: Obtain log information from Loki for visual display.

installation
To implement this log collection solution, you need to install services such as Loki, Promtail, and Grafana. It is very convenient to docker-composedocker-compose.ymlscript used is as follows, just use thedocker-composecommand to run it directly;
version: "3"

services:
  # 日志存储和解析
  loki:
    image: grafana/loki
    container_name: lpg-loki
    volumes:
      - /mydata/loki/:/etc/loki/
    # 修改loki默认配置文件路径
    command: -config.file=/etc/loki/loki.yml
    ports:
      - 3100:3100

  # 日志收集器
  promtail:
    image: grafana/promtail
    container_name: lpg-promtail
    volumes:
      # 将需要收集的日志所在目录挂载到promtail容器中
      - /mydata/app/mall-tiny-loki/logs/:/var/log/
      - /mydata/promtail:/etc/promtail/
    # 修改promtail默认配置文件路径
    command: -config.file=/etc/promtail/promtail.yml

  # 日志可视化
  grafana:
    image: grafana/grafana
    container_name: lpg-grafana
    ports:
- 3000:3000- Since we have mounted the configuration files of Loki and Promtail on the host, we need to prepare these two configuration files before running;
- The content of Loki's configuration file
/mydata/loki/loki.ymlis as follows, using the default configuration (you can run Loki's Docker container without mounting the configuration file, and then copy it from the container);
auth_enabled: false

server:
  http_listen_port: 3100

ingester:
  lifecycler:
    address: 127.0.0.1
    ring:
      kvstore:
        store: inmemory
      replication_factor: 1
    final_sleep: 0s
  chunk_idle_period: 1h       # Any chunk not receiving new logs in this time will be flushed
  max_chunk_age: 1h           # All chunks will be flushed when they hit this age, default is 1h
  chunk_target_size: 1048576  # Loki will attempt to build chunks up to 1.5MB, flushing first if chunk_idle_period or max_chunk_age is reached first
  chunk_retain_period: 30s    # Must be greater than index read cache TTL if using an index cache (Default index read cache TTL is 5m)
  max_transfer_retries: 0     # Chunk transfers disabled

schema_config:
  configs:
    - from: 2020-10-24
      store: boltdb-shipper
      object_store: filesystem
      schema: v11
      index:
        prefix: index_
        period: 24h

storage_config:
  boltdb_shipper:
    active_index_directory: /loki/boltdb-shipper-active
    cache_location: /loki/boltdb-shipper-cache
    cache_ttl: 24h         # Can be increased for faster performance over longer query periods, uses more disk space
    shared_store: filesystem
  filesystem:
    directory: /loki/chunks

compactor:
  working_directory: /loki/boltdb-shipper-compactor
  shared_store: filesystem

limits_config:
  reject_old_samples: true
  reject_old_samples_max_age: 168h

chunk_store_config:
  max_look_back_period: 0s

table_manager:
  retention_deletes_enabled: false
  retention_period: 0s

ruler:
  storage:
    type: local
    local:
      directory: /loki/rules
  rule_path: /loki/rules-temp
  alertmanager_url: http://localhost:9093
  ring:
    kvstore:
      store: inmemory
enable_api: true- The content of Promtail's configuration file
/mydata/loki/promtail.ymlis as follows, and the default configuration is used. Here,clients.urlneeds attention. Since we are usingdocker-composedeployment, we can use the service namelokias the domain name to access the Loki service;
server:
  http_listen_port: 9080
  grpc_listen_port: 0

positions:
  filename: /tmp/positions.yaml

clients:
  - url: http://loki:3100/loki/api/v1/push

scrape_configs:
- job_name: system
  static_configs:
  - targets:
      - localhost
    labels:
      job: varlogs
__path__: /var/log/*log- Run the
docker-compose.ymlscript to install all services, just use the following command;
docker-compose up -d- After running successfully, you can use the
docker ps |grep lpgcommand to view the service status.
[root@local-linux lpg]# docker ps |grep lpg
64761b407423        grafana/loki                            "/usr/bin/loki -conf…"   3 minutes ago       Up 3 minutes        0.0.0.0:3100->3100/tcp                           lpg-loki
67f0f0912971        grafana/grafana                         "/run.sh"                3 minutes ago       Up 3 minutes        0.0.0.0:3000->3000/tcp                           lpg-grafana
f2d78eb188d1        grafana/promtail                        "/usr/bin/promtail -…"   3 minutes ago       Up 3 minutes                                                         lpg-promtail
use
Next, we will use the LPG log collection system to collect the logs of the SpringBoot application. There is basically no special configuration for the SpringBoot application.
- First create a SpringBoot application, modify the configuration file
application.yml, and output the log to the/var/logsdirectory;
spring:
  application:
    name: mall-tiny-loki

logging:
  path: /var/logs
  level:
com.macro.mall.tiny: debug- Use the following command to run the SpringBoot application and mount the log directory to the host, so that Promtail can collect the logs;
docker run -p 8088:8088 --name mall-tiny-loki \
-v /etc/localtime:/etc/localtime \
-v /mydata/app/mall-tiny-loki/logs:/var/logs \
-e TZ="Asia/Shanghai" \
-d mall-tiny/mall-tiny-loki:1.0-SNAPSHOT- Log in to Grafana after successful operation, the account password is
admin:admin, after logging in successfully, you need to add Loki as the data source, access address: http://192.168.7.149:3000/

- Select Loki directly in the data source selection interface, we can see that Grafana also supports the use of Elasticsearch as a data source;

- Then set your Loki access address, click
Save&testsave and test, a green prompt message shows that the setting is successful, Loki access address: http://192.168.7.149:3100

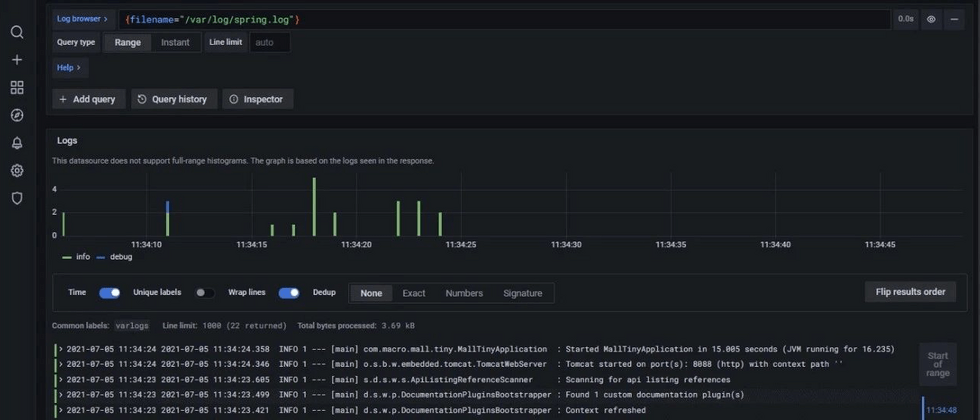
- Next,
Explore, and enter the query expression (Loki query) as{filename="/var/log/spring.log"}, you can view the log output by our SpringBoot application.

to sum up
This article mainly introduces the construction of the LPG log system and the use of it to collect SpringBoot application logs. The LPG log collection scheme is indeed very lightweight and has good performance! However, if you have a need for full-text search of logs, you still have to use the ELK system. If you are not familiar with Grafana, you can refer to this article "It is known as the next-generation visual monitoring system, combined with SpringBoot, it is cool! " .
Reference
- Loki official document: https://grafana.com/docs/loki/latest/overview/
- Promtail official document: https://grafana.com/docs/loki/latest/clients/promtail/
Project source code address
https://github.com/macrozheng/mall-learning/tree/master/mall-tiny-loki
This article GitHub https://github.com/macrozheng/mall-learning has been included, welcome to Star!


**粗体** _斜体_ [链接](http://example.com) `代码` - 列表 > 引用。你还可以使用@来通知其他用户。