This article is full of dry goods and long in length. It is recommended to read it after collection to avoid getting lost. Rongyun official account backstage reply [list stuck], you can directly receive all the materials involved in this article.
1. Background
As an IM software, the conversation list is the first interface the user comes into contact with. Whether the conversation list slides smoothly has a great impact on the user's experience. With the continuous increase of functions, there is more and more information to be displayed on the conversation list. We found that after calling Call and returning to the conversation list interface to slide, there may be a serious freeze. So we began to conduct a detailed analysis of the stuck situation in the conversation list.
Second, the cause of the lag
When it comes to the cause of the lag, we will all say that it is caused by the inability to complete the rendering within 16ms. So why does it need to be completed in 16ms? And what needs to be done within 16ms?
2.1 Refresh rate (RefreshRate) and frame rate (FrameRate)
The refresh rate refers to the number of times the screen is refreshed per second, which is specific to the hardware. At present, most mobile phones have a refresh rate of 60Hz (the screen refreshes 60 times per second), and some high-end phones use 120Hz (such as iPad Pro).
The frame rate is the number of frames drawn per second and is specific to the software. Generally, as long as the frame rate is consistent with the refresh rate, the picture we see is smooth. So when the frame rate is 60FPS, we will not feel the card.
If the frame rate is 60 frames per second, and the screen refresh rate is 30Hz, then the upper half of the screen still stays in the previous frame, and the lower half of the screen renders the next frame of the picture—— This situation is called screen tearing; on the contrary, if the frame rate is 30 frames per second and the screen refresh rate is 60Hz, then two consecutive frames will display the same screen, which will cause a freeze.
Therefore, it is meaningless to unilaterally increase the frame rate or refresh rate, and both need to be improved at the same time.
Due to the 60Hz refresh rate currently used in most Android screens, in order to achieve a frame rate of 60FPS, it is required to complete one frame of drawing within 16.67ms (1000ms/60Frame = 16.666ms / Frame).
2.2 VSYNC
Since the display starts from the top row of pixels and refreshes row by row downwards, there is a time difference between the refresh from the top to the bottom.
If the frame rate (FPS) is greater than the refresh rate, then the screen tearing mentioned above will occur. If the frame rate is higher, then the next frame has not had time to display, and the data of the next frame will be overwritten. The middle frame is skipped. This situation is called frame skipping.
In order to solve this problem that the frame rate is greater than the refresh rate, the vertical synchronization technology is introduced. Simply put, the display sends a vertical synchronization signal (VSYNC) every 16ms, and the system will wait for the arrival of the vertical synchronization signal before proceeding to a frame. Rendering and buffer update, so that the frame rate and refresh rate are locked.
2.3 How does the system generate a frame
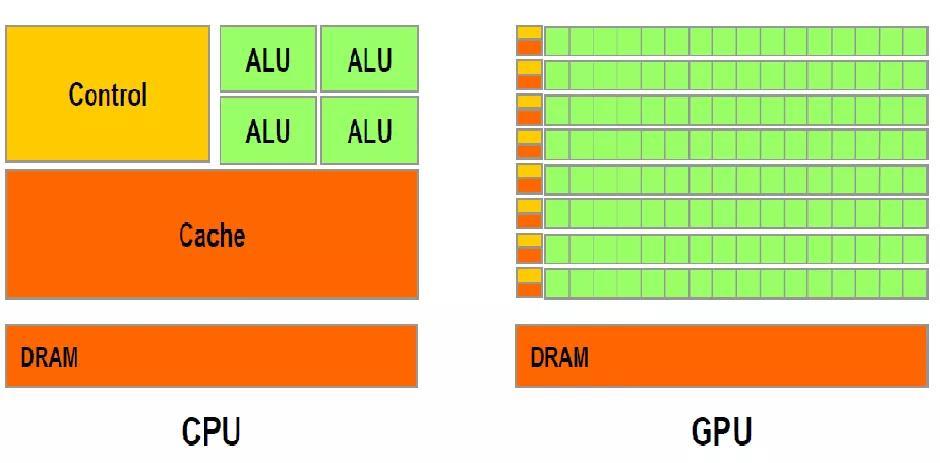
Before Android 4.0, processing user input events, drawing, and rasterization were all executed by the main thread of the application in the CPU, which could easily cause jams. The main reason is that the task of the main thread is too heavy to handle many events. Secondly, there are only a small number of ALU units (arithmetic logic units) in the CPU, which is not good at doing graphics calculations.
After Android 4.0, the application turns on hardware acceleration by default. After the hardware acceleration is turned on, the image operations that the CPU is not good at are handed over to the GPU to complete. The GPU contains a large number of ALU units, which are designed to achieve a large number of mathematical operations (so GPUs are generally used for mining). After the hardware acceleration is turned on, the rendering work in the main thread will be handed over to a separate rendering thread (RenderThread), so that when the main thread synchronizes the content to the RenderThread, the main thread can be released for other work, and the rendering thread completes the next work .
Then the complete one-frame process is as follows:
(1) First, in the first 16ms, the monitor displays the content of frame 0, and the CPU/GPU processes the first frame.
(2) After the arrival of the vertical synchronization signal, the CPU immediately processes the second frame, and after the processing is completed, it will be handed over to the GPU. The monitor displays the image of the first frame.
The whole process seems to be no problem, but once the frame rate (FPS) is less than the refresh rate, the screen will freeze.
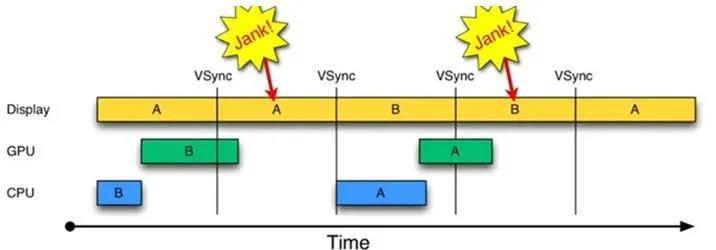
A and B on the figure represent two buffers respectively. Because the CPU/GPU processing time exceeds 16ms, in the second 16ms, the monitor should display the content in the B buffer, but now it has to repeatedly display the content in the A buffer, that is, the frame is dropped. ).
Because the A buffer is occupied by the display and the B buffer is occupied by the GPU, the CPU cannot start processing the content of the next frame when the vertical synchronization signal (VSync) arrives, so the CPU does not trigger in the second 16ms Drawing work.
2.4 Triple Buffer
In order to solve the problem of frame drop caused by the frame rate (FPS) less than the screen refresh rate, Android4.1 introduced a three-level buffer.
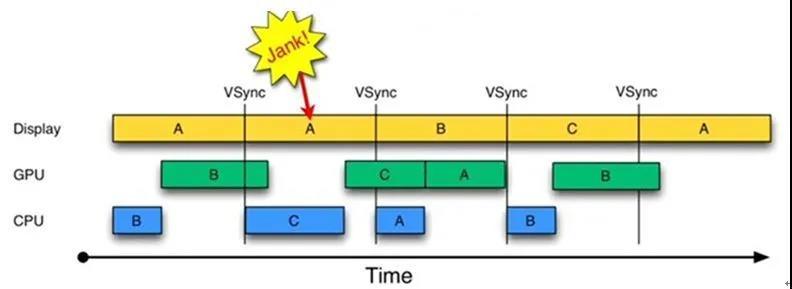
In the case of double buffering, since the Display and GPU each occupy a buffer, the CPU cannot draw when the vertical synchronization signal arrives. Then add a buffer now, and the CPU can draw when the vertical synchronization signal arrives.
In the second 16ms, although one frame is displayed repeatedly, when the Display occupies the A buffer and the GPU occupies the B buffer, the CPU can still use the C buffer to complete the drawing work, so that the CPU is also fully used. Land use. The subsequent display is also relatively smooth, effectively avoiding further aggravation of Jank.
Through the drawing process, we know that the stuttering is due to a dropped frame, and the reason for the dropped frame is that when the vertical synchronization signal arrives, the data is not ready for display. Therefore, if we want to deal with lag, we must shorten the time of CPU/GPU drawing as much as possible, so that we can ensure that one frame of rendering is completed within 16ms.
Three, problem analysis
With the above theoretical basis, we began to analyze the issue of the conversation list stuck. Since the Pixel5 used by Boss is a high-end machine, the lag is not obvious, we deliberately borrowed a low-end machine from the test classmates.
Before optimization, what is the mobile phone refresh rate:
It's 60Hz, no problem.
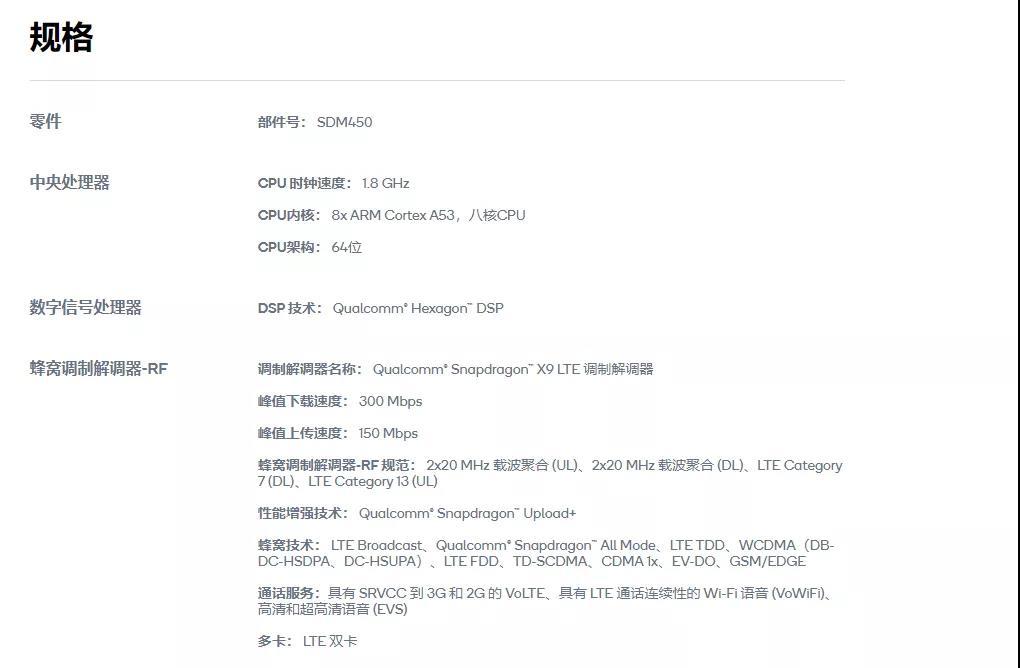
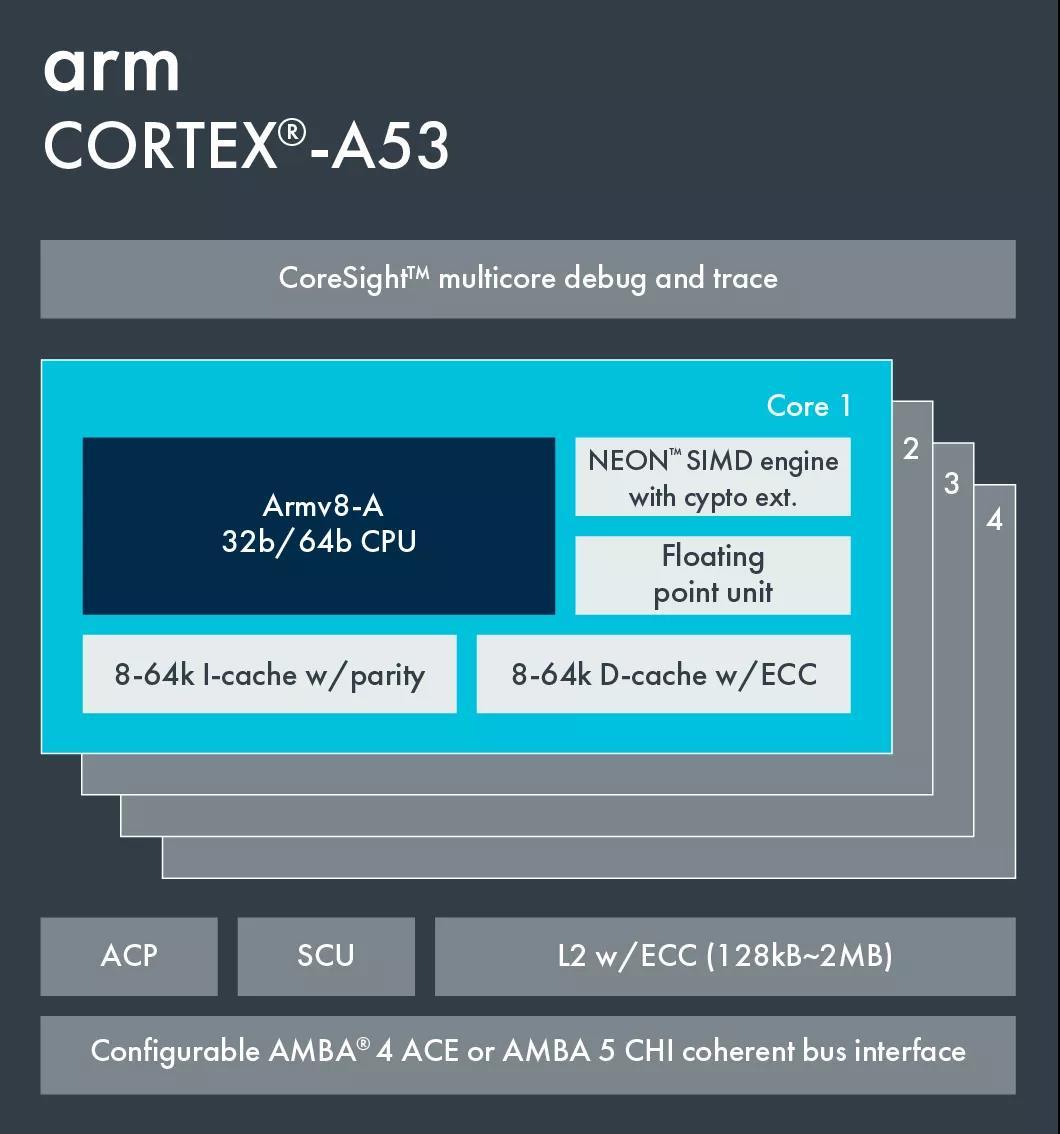
Check the specific architecture of SDM450 on the Qualcomm website:
It can be seen that the CPU of this phone is an 8-core A53 Processor.
The A53 Processor is generally used as a small core in the large and small core architecture. Its main function is to save power. Those scenes with low performance requirements are generally responsible for them, such as standby state, background execution, etc., and A53 does take power consumption To the extreme.
On Samsung Galaxy A20s mobile phones, all use this processor, and there is no large core, so the processing speed will naturally not be very fast, which requires our APP to be optimized better.
After having a general understanding of the mobile phone, we use the tool to check the freeze point.
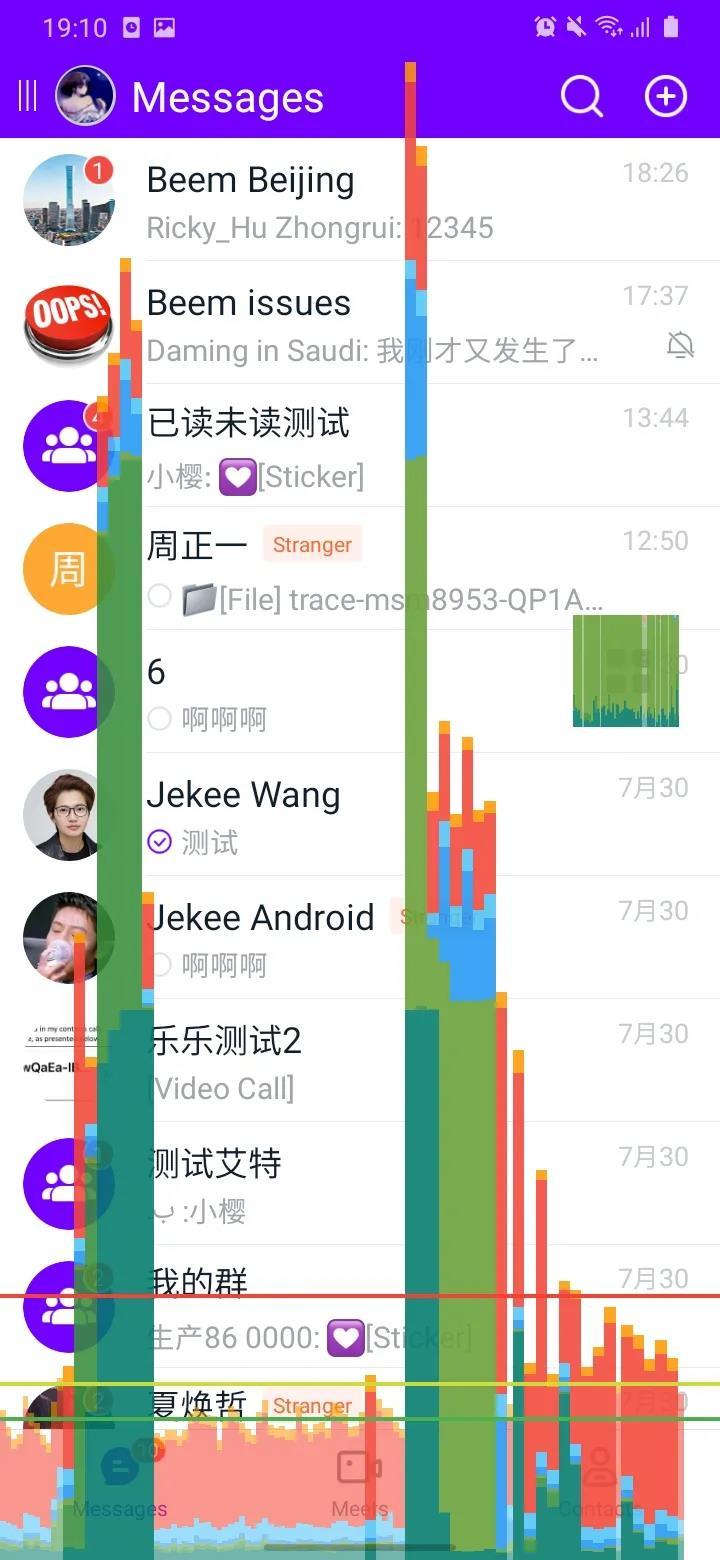
First, open the GPU rendering mode analysis tool that comes with the system to view the session list.
You can see that the histogram has been higher than the sky. At the bottom of the figure, there is a green horizontal line (representing 16ms). If this horizontal line is exceeded, frame drop may occur.
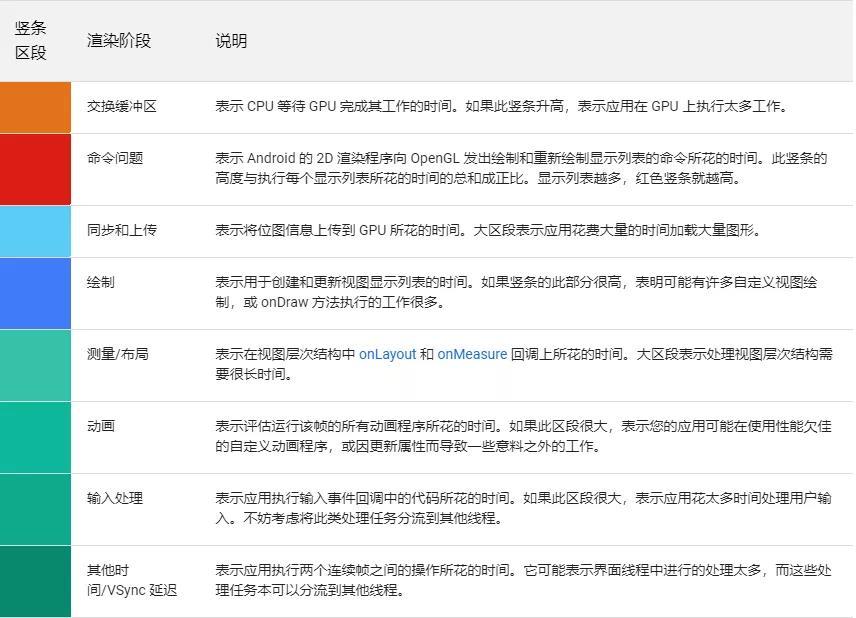
According to the color mapping table given by Google, let's take a look at the approximate location of the time-consuming. First of all, we must make it clear that although this tool is called the GPU rendering mode analysis tool, most of the operations displayed in it occur in the CPU.
Secondly, according to the color comparison table, you may also find that the colors given by Google do not correspond to the colors on the real phone. So we can only judge the approximate location of the time-consuming.
As you can see from our screenshots, the green part accounts for a large proportion, part of which is Vsync delay, and the other part is input processing + animation + measurement/layout.
The explanation given in the Vsync delay icon is the time it takes for the operation between two consecutive frames. In fact, when SurfaceFlinger distributes Vsync next time, it will insert a message of Vsync arrival into the UI thread's MessageQueue, and the message will not be executed immediately, but will be executed after the previous message is executed. So Vsync delay refers to the time between when Vsync is put into the MessageQueue and when it is executed. The longer this part of the time, the more processing is performed in the UI thread, and some tasks need to be offloaded to other threads for execution.
Four, optimization plan and practice
4.1 Asynchronous
After having a general direction, we started to optimize the conversation list.
In the problem analysis, we found that Vsync has a large delay, so the first thing we thought of was to strip out the time-consuming tasks in the main thread and put them in the worker thread for execution. In order to locate the main thread method faster and time-consuming, you can use Didi's Dokit or Tencent's Matrix for slow function positioning.
This part of the logic is executed in the main thread, and it takes about 80ms. If there are many conversation lists and large changes in database table data, this part of the time consumption will increase.
We also found that every time you enter the session list, you need to get the session list data from the database, and you will also read the session data from the database when you load more. After reading the session data, we will filter the acquired sessions. For example, sessions that are not in the same organization should be filtered out. After the filtering is completed, the duplicate will be removed. If the session already exists, the current session will be updated; if it does not exist, a new session will be created and added to the session list, and then the session list needs to be sorted according to certain rules, and finally notified The UI refreshes.
The time-consuming of this part is 500ms-600ms, and the time-consuming will increase as the amount of data increases, so this part must be executed in a sub-thread. But you must pay attention to thread safety issues, otherwise data will be added multiple times, and multiple duplicate data will appear on the session list.
4.2 increase cache
When checking the code, we found that there are many places to get the current user information, and the current user information is stored in the local SP (later changed to MMKV) and stored in Json format. Then when the user information is obtained, it will be read from the SP (IO operation), and then deserialized into an object (reflection).
It would be very time-consuming to obtain the current user's information in this way every time. In order to solve this problem, we cache the user information obtained for the first time, and return it directly if the current user information exists in the memory, and update the object in the memory every time the current user information is modified.
4.3 Reduce the number of refreshes
In this scheme, on the one hand, it is necessary to reduce unreasonable refreshes, and on the other hand, it is necessary to change partial global refresh to partial refresh.
Extract the code that notifies the page refresh to the outside of the loop, and wait for the data to be refreshed once after the update is complete. (The detailed plan can be viewed in the Rongyun official account)
4.4 onCreateViewHolder optimization
When analyzing the Systrace report, we discovered this situation-a swipe was accompanied by a large number of CreateView operations. Why does this happen? We know that RecyclerView itself has a caching mechanism. If the layout of the newly displayed item is the same as the old one during sliding, CreateView will not be executed again, but the old item will be reused, and bindView will be executed to set the data, which can reduce the time of creating a view. IO and reflection are time-consuming. (The detailed plan can be viewed in the Rongyun official account)
4.5 Preload + global cache
Although we have reduced the number of CreateViews, we still need CreateView on the first screen when we first enter, and we find that CreateView takes a long time.
Can this part of time be optimized? The first thing we thought of was to use asynchronous loading of the layout in onCreateViewHolder, placing IO and reflection in the child thread. Later, this solution was removed. The specific reason will be discussed later. If it can't be loaded asynchronously, then we will consider the operation of creating View to be executed in advance and cached. (The detailed plan can be viewed in the Rongyun official account)
4.6 onBindViewHolder optimization
When we checked the Systrace report, we also found that in addition to the time-consuming CreateView, BindView is also very time-consuming, and this time-consuming even exceeds CreateView. In this way, if 10 items are newly displayed during a sliding process, it will take more than 100 milliseconds. This is absolutely unacceptable, so we started to clean up the time-consuming operation of onBindViewHolder. (The detailed plan can be viewed in the Rongyun official account)
4.7 Layout optimization
In addition to reducing the time-consuming of BindView, the level of layout also affects the time-consuming of onMeasure and onLayout. We found that measurement and layout took a lot of time when using the GPU rendering mode analysis tool, so we plan to reduce the layout level of the item.
In addition to removing the repeated background, we can also minimize the use of transparency. The Android system draws the same area twice when drawing transparency, the first time is the original content, and the second time is the newly added transparency effect. Basically, the transparency animation in Android will cause overdrawing, so you can minimize the use of transparency animation, and try not to use the alpha attribute on the View. For the specific principle, please refer to the official Google video (the video link can be obtained through the backstage reply [list stuck] of Rongyun WeChat official account).
4.8 Other optimizations
In addition to the optimization points mentioned above, there are some small optimization points:
(1) For example, if you use a higher version of RecyclerView, the prefetch function will be enabled by default.
From the above figure, we can see that the UI thread has been idle after completing the data processing and handing it over to the Render thread. It needs to wait for the arrival of a Vsync signal to process the data, and this idle time is wasted, and the prefetching is enabled. This free time can be used wisely in the future.
(2) Set the setHasFixedSize method of RecyclerView to true. When the width and height of our item are fixed, use Adapter's onItemRangeChanged(), onItemRangeInserted(), onItemRangeRemoved(),
The onItemRangeMoved() methods update the UI without recalculating the size.
(3) If you do not use RecyclerView animation, you can pass ((SimpleItemAnimator) rv.getItemAnimator()).setSupportsChangeAnimations(false) to turn off the default animation to improve efficiency.
V. Deprecated solutions
In the process of optimizing the session list lag, we adopted some optimization schemes, but we did not adopt them in the end. They are also listed here for explanation.
5.1 Asynchronous loading layout
As mentioned in the previous article, in the process of reducing the time consumption of CreateView, we initially planned to use asynchronous loading layout to execute IO and reflection in sub-threads. We use Google's official AsyncLayoutInflater to load the layout asynchronously. This class will call back to notify us when the layout is loaded. But it is generally used in the onCreate method. In the onCreateViewHolder method, the ViewHolder needs to be returned, so there is no way to use it directly.
In order to solve this problem, we have customized an AsyncFrameLayout class, which inherits from FrameLayout, we will add AsyncFrameLayout as the root layout of ViewHolder in the onCreateViewHolder method, and call the custom inflate method to load the layout asynchronously, and the load is successful Later, the successfully loaded layout will be added to AsyncFrameLayout as a child View of AsyncFrameLayout.
5.2 DiffUtil
DiffUtil is a data comparison tool officially provided by Google. It can compare two sets of new and old data, find out the differences, and then notify RecyclerView to refresh. DiffUtil uses Eugene W. Myers' differential algorithm (relevant information can be obtained through Rongyun WeChat official account backstage reply [list stuck]) to calculate the minimum number of updates to convert one list to another. But comparing data will be time-consuming, so you can also use the AsyncListDiffer class to perform the comparison operation in an asynchronous thread.
5.3 Refresh when sliding stops
In order to avoid a large number of refresh operations on the conversation list, we recorded the data update when the conversation list was sliding, and waited for the sliding to stop before refreshing. However, in the actual test process, the refresh after the stop will cause the interface to freeze once, which is more obvious on the low-end and mid-range computers, so this strategy is abandoned.
5.4 Pagination loading in advance
Since the number of session lists may be large, we use paging to load data. In order to ensure that users do not perceive the waiting time for loading, we intend to obtain more data before the user is about to slide to the end of the list, so that the user can slide down without a trace. The idea is ideal, but in practice, it is also found that there will be a momentary freeze on the low-end machine, so this method is temporarily abandoned.
In addition to the above schemes are abandoned, we found in the optimization process that the conversation list of other brands of similar products is actually not very fast. If the sliding speed is slow, then the number of items that need to be displayed in a sliding process will be small. , So that one swipe does not need to render too much data. This is actually an optimization point. Later we may consider the practice of reducing the sliding speed.
Six, summary
In the development process, with the continuous addition of business, the complexity of our methods and logic will continue to increase. At this time, we must pay attention to the time-consuming methods, and extract them to sub-threads as much as possible for execution. When using Recyclerview, don't refresh it brainlessly. Those that can be refreshed locally will never be refreshed globally, and those that can be delayed will never be refreshed immediately. When analyzing the freeze, you can use tools to improve the efficiency. After finding the general problem and troubleshooting direction through Systrace, you can locate the specific code through the Profiler that comes with Android Studio.


**粗体** _斜体_ [链接](http://example.com) `代码` - 列表 > 引用。你还可以使用@来通知其他用户。