Abstract: Interpretation of OpenMetric specifications and indicator model definitions, combined with the current mainstream time series database core storage and processing technology, try to let users (architects, developers or users) choose the right products according to their own business scenarios, and eliminate The confusion of technology selection.
This article is shared from the Huawei Cloud Community " [Dry Goods] OpenMetric and Time Series Database Storage Model Analysis ", author: agile Xiaozhi.
Summary
In recent years, the time series database has developed rapidly, and the monitoring index of the IT system is a typical time series data. Due to the widespread adoption of cloud computing, containers, microservices, and serverless, and the large-scale and complex business systems; coupled with the vigorous development of IoT, the collection, storage, processing and analysis of massive time series data are facing new requirements and challenges. Based on the interpretation of OpenMetric specifications and indicator model definitions, combined with the current mainstream time series database core storage and processing technology, try to let users (architects, developers, or users) choose appropriate products based on their own business scenarios, and eliminate technology selection Confusion. Combining with the latest developments of cloud service providers, it provides users with out-of-the-box, highly reliable alternatives, accelerates application construction and the improvement of operational and maintenance capabilities, focuses on core business, and promotes business success.
background
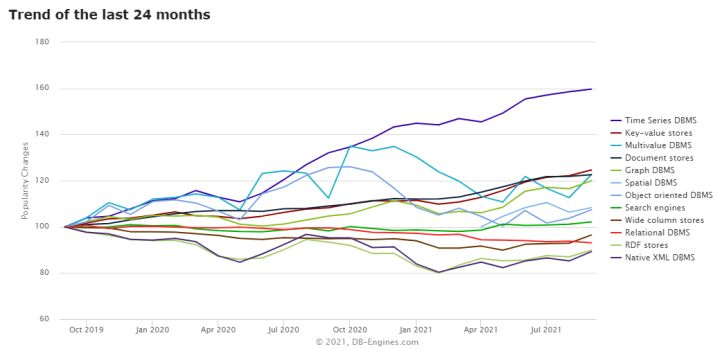
Refer to the DB-ENGINES website [1] for the ranking of major databases, which is an important reference index for database product selection. Especially for different business scenarios and demands, focus on those database products with high scores and rankings in the vertical segmentation field. For example, according to the survey statistics and scoring chart of DB-Engines by database category (see Figure 1 below), the time series database (TSDB) ranked first among the fastest-growing database types in the last 2 years, especially in the last year. Here, it's even better!
figure 1
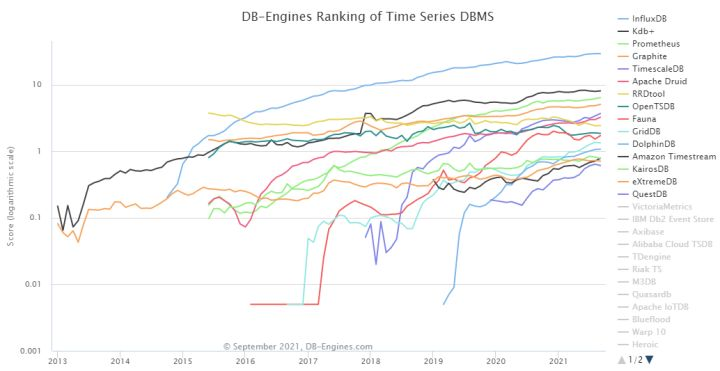
Judging from the DB-Engines score trend chart on TSDB (see Figure 2 below), mainstream TSDBs include InfluxDB, Prometheus, TimescaleDB, Apache Druid, OpenTSDB, and so on.
figure 2
In fact, the popular ClickHouse and Apache IoTDB in the industry also belong to the category of time series databases. From the application operation and maintenance scenarios, this article makes a preliminary analysis of many TSDBs and screens out typical representative products to facilitate targeted comparative analysis later.
- InfluxDB: Ranked first, the community is hot and there are many domestic and foreign adopters.
- Prometheus: It belongs to the second graduated project of the CNCF Foundation. It is quite popular in the community. It even forms a factual monitoring default scheme in the container field. It is widely adopted at home and abroad.
- TimescaleDB: A time-series database constructed based on excellent PostgreSQL. In the long run, a professional TSDB must be designed and optimized for the characteristics of time series data from the underlying storage. Therefore it is not further analyzed in this article.
- Apache Druid: A very well-known real-time OLAP analysis platform, designed for time series data, and has a certain balance between extreme performance and flexibility of data schema. Similar products include Pinot, Kylin, etc.
- OpenTSDB: A time series database based on HBase, which relies too heavily on the Hadoop ecosystem and keeps pace with InfluxDB in the early days; in recent years, the popularity in the community has fallen far behind InfluxDB. It also does not support multi-dimensional queries. Therefore, it is also excluded.
- ClickHouse: A data analysis database (OLAP) developed by Yandex, Russia, but it can be used as a TSDB. This article does not do in-depth analysis.
- IoTDB: Open source time series database of Tsinghua University in China, oriented to industrial IoT scenarios; outstanding performance and active community.
Combined with the popularity of domestic users and communities, this article selects representative InfluxDB, Prometheus, Druid, and IoTDB to further analyze their storage cores.
Characteristics of time series data in the operation and maintenance domain:
• Immutability (Immutable)
• Real-time (realtime), the longer the history of the data, the lower its potential value. On the one hand, it is streaming writing, on the other hand, it is near real-time query or instant analysis.
• Mass (Volumne) a live broadcast platform, high-speed real-time write 20 million/s; structured data up to 200TB/d. If you consider some logical multi-tenant time series database applications of cloud service vendors, there are higher requirements for peak writes and peak queries.
• High compression rate: Too much data directly affects storage costs, so high-performance data compression is a must-have feature.
Time series data model
Before starting this article, I will list some professional terms to facilitate unified cognition. To be honest, even professionals in the field of database or operation and maintenance are often confused by various Chinese translations. In order to reduce ambiguity, this article habitually remarks the corresponding original English terms after some keywords to facilitate everyone's understanding.
basic concept
Time series (Time series, referred to as time series or time series data): According to Wikipedia [2], its mathematical definition is this: In mathematics, a time series is a series of data points indexed (or listed or graphed) in time order . Most commonly, a time series is a sequence taken at successive equally spaced points in time. Thus it is a sequence of discrete-time data. A series of data points. Therefore, it is often translated as "time series data." 3) The most common is the sequence acquired at consecutive equally spaced time points. 4) It is a discrete time data sequence.
Metric (Metric): In the software field, Metric is a measurement of certain attributes of software or its specifications. There is such an explanation in Wikipedia: software metric [3] is a standard to measure the degree to which a software system or process has a certain attribute. Although academia initially believed that Metric is a function and Measurement is a value obtained through the application of metric; however, with the reference and integration of computer science and traditional science, these two terms are usually also used as synonyms, generally referring to the same thing.
The relationship between the two: Simply put, many metrics with timestamps are put together to form a Time series.
Time series data generally has the following salient features:
• Each piece of data must have its own time stamp, and the data is sorted by time
• Immutable: Once written, there is basically no modification or single deletion. (Because aging expired, you can delete it)
• The amount of data is large, and it is generally required to support the PB level. It also requires high throughput.
• Efficient storage and compression efficiency, reducing costs
• The core purpose of time series is data analysis, including downsampling, data interpolation and spatial aggregation calculations, etc.
• The uniqueness of time series: there is only one data (or point) for a certain indicator at a certain moment, and multiple pieces of data will be regarded as the same data (or point) even if there are multiple pieces of data
• A single piece of data is not important
OpenMetrics specification
OpenMetrics[4]: A cloud-native, highly scalable metrics protocol. It defines the de facto standard for large-scale reporting of cloud-native indicators, and supports the text representation protocol and the Protocol Buffers protocol. Although time series can support arbitrary string or binary data, the RFC only addresses and includes digital data. Thanks to the popularity of Prometheus, as Prometheus' monitoring data collection solution, OpenMetrics may soon become the industry standard for future monitoring.
At present, most of the popular open source services have official or unofficial exporters available for use. Implementers must expose metrics in OpenMetrics text format in response to simple HTTP GET requests for the documented URL of a given process or device. This endpoint should be called "/metrics". Implementers can also expose metrics in OpenMetrics format in other ways, such as periodically pushing metrics sets to endpoints configured by operators via HTTP.
Remarks: Event (Event) is the opposite of an indicator, a single event occurs at a specific moment; and an indicator is a time series. This concept is very important in the operation and maintenance domain.
Data model
• OpenMetrics defines the data model [5] as follows:
• Value: It must be a floating point number or an integer.
• Timestamp: Must be a Unix Epoch in seconds.
• String: must consist of only valid UTF-8 characters
• Label: A key-value pair composed of strings. Label names beginning with an underscore are reserved and generally should not be used.
• Label Set: It must be composed of labels and can be empty. The tag name must be unique in the tag set.
• MetricPoint: Each MetricPoint consists of a set of values, depending on the MetricFamily type. MetricPoints should not have a clear time stamp.
• Metric: Defined by the only LabelSet in MetricFamily. Metrics must contain a list of one or more MetricPoints. Metrics with the same name for a given MetricFamily should have the same set of label names in their LabelSet. If multiple MetricPoints are exposed for a metric, their MetricPoints must have monotonically increasing timestamps.
• Metric Family (also translated as "Metric Family", MetricFamily): A MetricFamily can have zero or more indicators. MetricFamily must have name, HELP, TYPE, and UNIT metadata. Each Metric in MetricFamily must have a unique LabelSet.
The MetricFamily name is a string and must be unique in the MetricSet.
Suffixes: OpenMetrics defines the suffixes used for the sample metric names in text format (different data types have different suffixes):
Counter:'_total','_created'
Summary:'_count','_sum','_created'
Histogram:'_count','_sum','_bucket','_created'
GaugeHistogram: '_gcount', '_gsum', '_bucket'
Information Info:'_info'
The type specifies the MetricFamily type. There are 8 indicator types for effective values (refer to the following text).
• MetricSet: It is the top-level object exposed by OpenMetrics. It must be composed of MetricFamilies. Each MetricFamily name must be unique. The same label name and value should not appear on every metric in the MetricSet. No specific MetricFamilies ordering is required in MetricSet.
Although OpenMetric defines some concepts in a trivial and detailed way, or even obscure; but from the perspective of big logic, it still includes timestamps, indicators, tags, and basic data types, which basically conform to everyone's daily thinking.
Metric Type
The OpenMetrics specification defines 8 types of indicators:
Gauge ( meter reading, Chinese translation is inaccurate): It is the current measurement value, such as the current CPU utilization or the size of memory bytes. For Gauge, what users (we) are interested in is its absolute value. In layman's terms, the Gauge type indicator is like the current value corresponding to the pointer in the dashboard of our car (increases, decreases or does not move, so it is variable; the value is greater than zero). The MetricPoint whose type is Gauge in the Metric must be a single value (it is impossible to point to multiple scale positions at the same time with respect to the pointer of the dashboard).
Counter (counter): It measures discrete events. MetricPoint must have a value called Total. Total must start from 0 monotonically and non-decreasing with time. Generally speaking, users are mainly interested in the speed at which the Counter increases over time.
StateSet (State Set): StateSet represents a series of related Boolean values, also known as bit sets. A point measured by the StateSet may contain multiple states, and each state must contain a Boolean value. The state has a string name.
Info (information indicators): Information indicators are used to disclose text information that should not be changed during the process life cycle. Common examples are the version of the application, revision control submission, and the version of the compiler. Information can be used to encode ENUM whose value does not change over time, such as the type of network interface.
Histogram (Histogram): The histogram measures the distribution of discrete events. Common examples are the latency of HTTP requests, function runtime, or I/O request size. The histogram MetricPoint must contain at least one bucket, and it should contain Sum and Created values. Each bucket must have a threshold and a value.
GaugeHistogram (meter histogram): measure the current distribution. Common examples are the time items are waiting in the queue, or the size of the request in the queue.
Summary (Summary): Summary measures the distribution of discrete events, and can be used when the histogram calculation is too expensive or the average event size is sufficient. The MetricPoint in a metric of type Summary that contains a Count or Sum value should have a Timestamp value named Created. This can help the ingester distinguish between new indicators and long-running indicators that have not been seen before.
Unknown (Unknown): Unknown can be used when the type of a single indicator from the 3rd party system cannot be determined. It cannot be used under normal circumstances.
In layman's terms, histogram is used to represent the sampling of data within a period of time, and to perform statistics according to the specified time interval and total number. It needs to be calculated according to the statistical interval. The Summary is used to represent the results of data sampling within a period of time, and directly store quantile data without calculation. Essentially Summary is similar to histogram. For more details, please refer to the official document [6].
Time series data model based on tags (tag-value)
The current mainstream TSDB time series data model is mainly based on tags (tags, also known as labels) to uniquely determine a time series (generally, indicator names, timestamps, etc.) are also attached.
Prometheus time series data model
This article analyzes the modeling of time series data from the most popular Prometheus monitoring system in the CNCF community. Prometheus uses a multi-dimensional data model, including metric names, one or more labels (labels, which have the same meaning as tags), and metric values.
The time series data model includes metric name, one or more labels (the same tags), and metric value. Metric name plus a set of labels as a unique identifier to define the time series, that is, the timeline.
The indicator model of Prometheus is defined as follows:
<metric name>{<label name>=<label value>, ...}
Metric name (metric name): Represents the general characteristics of the system under test, that is, a metric that can be measured. It uses a common name to describe a time series, such as sys.cpu.user, stock.quote, env.probe.temp, and http_requests_total, where http_requests_total can represent the total number of HTTP requests received.
Label: The implementation is supported by the dimensional data model of Prometheus. Any given combination of tags with the same metric name identifies a specific dimension instance of that metric. Changing any label value, including adding or removing labels, will create a new time series. Therefore, the query language can easily achieve filtering, grouping and matching through tags.
Sample: The data collected in the time dimension according to a certain sequence is called a sample. The actual time series, each series includes a float64 value and a millisecond-level Unix timestamp. Essentially it is a single value model.
Single-value model time series/time series: Data streams with time-stamped values with the same indicator name and the same label dimension set. In layman's terms, the metric name plus a set of labels is used as a unique identifier to define the timeline.
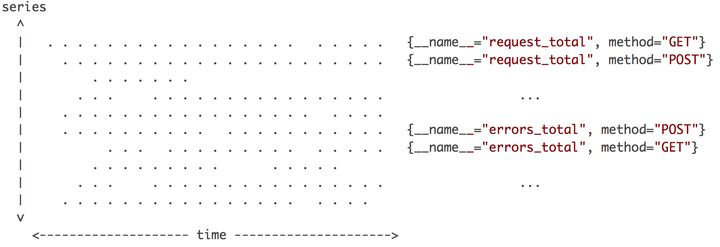
image 3
Figure 3 above is a schematic diagram of the distribution of related data points in a certain period of time [7], where the horizontal axis is time, the vertical axis is the time line, and each point in the area is a data point. The indicator name and a set of labels uniquely determine a timeline (that is, each horizontal line). At the same time, each timeline will only generate one data point, but there will be multiple timelines that generate data at the same time. Connecting these data points together is a vertical line. Therefore, every time Prometheus receives data, it receives a vertical line in the figure. The characteristics of these horizontal and vertical lines are very important, affecting numerical interpolation, as well as optimization strategies for data writing and compression.
InfluxDB time series data model
Figure 4 below is a graphical representation of InfluxDB's time series data model:
Figure 4
measurement:
The indicator object, that is, a data source object. Each measurement can have one or more index values, which is the field described below. In practical applications, an object that is detected in reality (such as "cpu") can be defined as a measurement. Measurement is a container for fields, tags, and time columns. The name of measurement is used to describe the field data stored in it, similar to the mysql table name.
tags:
The concept is equivalent to tags in most time series databases, and the data source can usually be uniquely identified by tags. The key and value of each tag must be strings.
field:
The specific index value recorded by the data source. Each indicator is called a "field", and the indicator value is the "value" corresponding to the "field". Fields are equivalent to SQL columns without indexes.
timestamp:
The time stamp of the data. In InfluxDB, the timestamp can theoretically be accurate to the nanosecond (ns) level
The data in each Measurement, logically speaking, will be organized into a large data table (see Figure 5 below). Tag is used to describe Measurement, and Field is used to describe Value. From the perspective of internal implementation, Tag will be fully indexed, but Filed will not.
Figure 5
Timeline under the multi-value model (Series): Before discussing Series, let’s take a look at the definition of a series key: a collection of data points that share a measurement, a tag set, and a field key. It is one of the core concepts of InfluxDB. For example, in the figure above, census, location=klamath, scientist=anderson bees form a series key. Therefore, there are 2 series keys in the above picture. And Series is the timestamp and field value corresponding to a given series key. For example, in the above figure, the series with the series key of census, location=klamath, scientist=anderson bees is:
2019-08-18T00:00:00Z 23
2019-08-18T00:06:00Z 28
Therefore, the series key in InfluxDB can be understood as what we usually call the timeline (or the key of the timeline), and the series is the value contained in the timeline (equivalent to data points). Both refer to the time series/timeline in TSDB in general, but they are logically distinguished from the perspective of key-value pairs.
Summary: As shown in Figure 6 below, time series data is generally divided into two parts, one is an identifier (index name, label or dimension), which is convenient for searching and filtering; the other is a data point, including timestamps and metric values. Numerical values are mainly used for calculation and generally do not build indexes. From the number of values contained in data points, it can be divided into single-value models (such as Prometheus) and multi-value models (such as InfluxDB); from the perspective of data point storage, there are row storage and column storage. In general, column storage can have better compression ratio and query performance.
Image 6
Time series data model based on tree schema
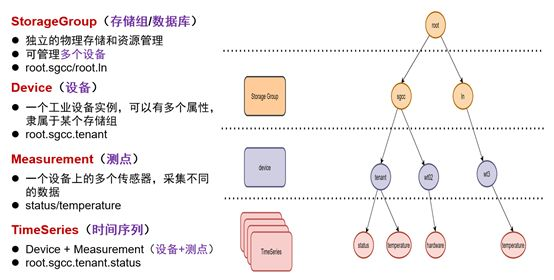
The biggest difference between the data model of IoTDB and other TSDBs is that it does not use the tag-value, Labels mode, but uses a tree structure to define the data mode: root is the root node, and storage groups, devices, and sensors are connected in series. The tree structure forms a path (Path) from the root node, through the storage group, the device, and the sensor leaf node. A path can name a time series, and the levels are connected by ".". As shown in Figure 7 below [8]:
Figure 7
Data point: A "time-value" pair.
Time series (a certain physical quantity of an entity corresponds to a time series, Timeseries, also called measuring point meter, timeline timeline, often called tag, parameter parameter in real-time database): A certain physical quantity of a physical entity is on the time axis The record is a sequence of data points. Similar to a table in a relational database, but this table mainly has three main fields: Timestamp, Device ID, and Measurement; it also adds extended fields such as Tag and Field , Where Tag supports indexing, while Field does not support indexing.
The tree-based schema of IoTDB is very different from other TSDBs. It has the following advantages:
- Equipment management is hierarchical: for example, equipment management in many industrial scenarios is not flat, but hierarchical. In fact, there are similar scenarios in application software systems. For example, CMDB maintains a hierarchical relationship between software components or resources. Therefore, IoTDB believes that tree-based schema is more suitable for IoT scenarios than tag-value schema.
- Relative invariance of tags and their values: In a large number of practical applications, the names of tags and their corresponding values are unchanged. For example, a wind turbine manufacturer always uses the country where the wind turbine is located, the wind farm it belongs to, and the ID in the wind farm to identify a wind turbine. Therefore, a 4-storey tree ("root.the-country-name.the -farm-name.the-id”) can be expressed clearly and concisely; to a certain extent, the repeated description of the data pattern is reduced.
- Flexible query: Path-based time series ID definition, more convenient and flexible query, for example: "root. ", where * is a wildcard.
Concept comparison of TSDB
First, compare and map the basic concepts of mainstream TSDB from the perspective of RDB to facilitate everyone's understanding.
Table 1
As can be seen from Table 1 above, the logical concept of database reflects more of a data schema definition, which facilitates the logical organization and division of data (such as InfluxDB's database), management (such as Druid's three schema definitions) and storage (such as IoTDB) Storage group). In addition, OpenMetric belongs to the indicator specification, which more reflects the definition of data points and the management of logical details (such as MetricSet, MetricFamilies, MetricPoint, LabelSet, etc., which are very detailed and complicated).
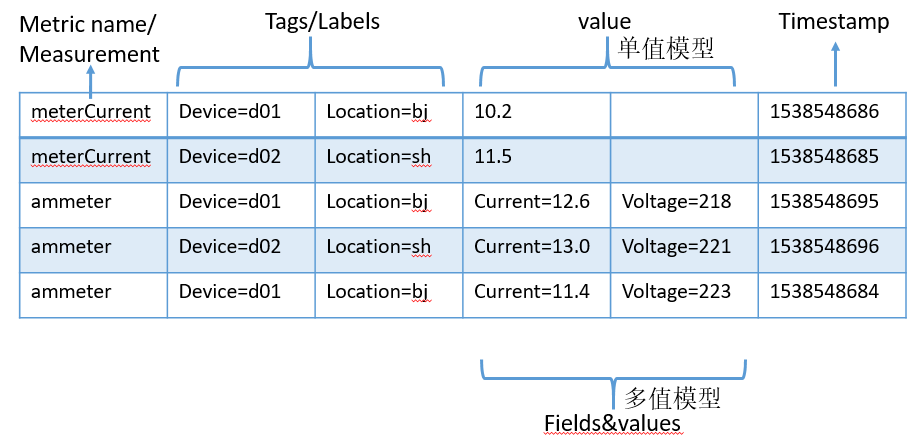
Secondly, we analyze from the perspective of each data point or row of data in the time series data set, as shown in Figure 8 below.
Figure 8
The basic model of time series data can be divided into the following parts:
Metric: The measured data set, similar to the table in the relational database, is a fixed attribute and generally does not change with time
Timestamp: Timestamp, which characterizes the point in time when the data is collected
Tags: Dimension column, used to describe the metric, representing the attribution and attributes of the data, indicating which device/module generated it, and generally does not change over time
Field/Value: Index column, representing the measured value of the data, which can be single value or multi-value
Focusing on the above time series data model, let's compare and look at the correspondence between the basic concepts in various TSDBs, as shown in Table 2 below:
Table 2
OpenMetric is a community specification about metrics, which is still evolving, and is often officially part of the IETF standard. At present, its modeling is too detailed (so that the concepts are cross-fuzzy and difficult to understand). Instead, after years of practice in TSDB, the model abstraction of time series data is more direct and efficient.
Reference
[1] https://db-engines.com/en/
[2] https://en.wikipedia.org/wiki/Time_series
[3] https://en.wikipedia.org/wiki/Software_metric
[5] https://github.com/OpenObservability/OpenMetrics/blob/main/specification/OpenMetrics.md
[6] https://prometheus.io/docs/practices/histograms/
[7] Fabian Reinartz, https://fabxc.org/tsdb/
[8] https://bbs.huaweicloud.com/blogs/280943
Click to follow and learn about Huawei Cloud's fresh technology for the first time~




**粗体** _斜体_ [链接](http://example.com) `代码` - 列表 > 引用。你还可以使用@来通知其他用户。