
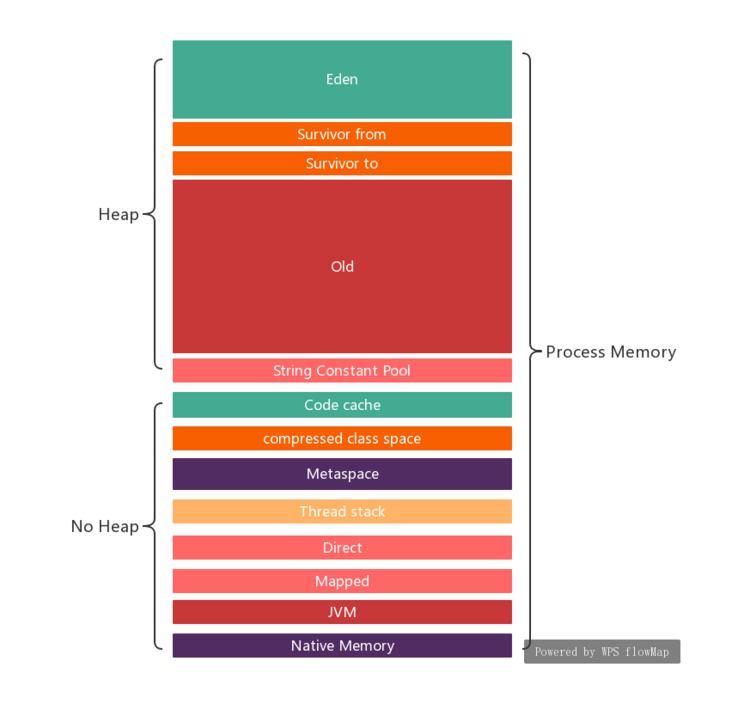
I believe many people know that in a cloud environment, all services must be resource-constrained. Of course, memory as an important resource is no exception. Restriction is easy to say, but how to guarantee the performance index (SLA) of the service while restricting is a technical and artistic work. Setting an upper limit for application memory is never easy. Because the rationale for setting the upper limit is: If it is Java, add: The above three aspects can be further subdivided. Each subdivision has its memory mechanism. As long as we miss one of them, it is possible that the total memory usage of the application will exceed the limit. What is worrying is that when the total memory usage of the application exceeds the limit, the operating system will ruthlessly kill the application process (OOM, Out Of Memory) . Many people are ignorant of this and only know that the container has restarted. And this may be the beginning of a chain reaction: JVM is a Nice manager. When it finds that memory is tight, it takes the trouble to stop application threads and perform GC. This kind of memory tight signal is called "Backpressure" in the design world. In conclusion, the container process OOM Kllled is something that should be avoided, but it requires in-depth research to avoid it. On the Internet, we can find many real cases and lessons: Java memory management is complicated. The more we know about it, the less likely it is that the application will appear OOM Killed. Below I take a test case encountered for analysis. The analysis report is divided into two parts: Before I start talking about JVM capacity configuration, I assume that you already have a basic impression of JVM memory usage: It means that if you say it, you don't say it. In my test environment, I use 3221225472/1024/1024 = 3072.0 Mb If you want to go deeper, please refer to: https://developer.aliyun.com/article/2948 The application uses Jetty, and the thread pool configuration is Because in addition to Jetty, there are various other threads. After the application has been warmed up and pressure tested, use Look at usage from the perspective of native applications, including the following: Total native application consumption: 16+8+158 = 182Mb summary: 4001Mb, here we did not count the Below I try to analyze the data source of each sub-item Run the command: Part of the output: As we all know, modern operating systems have mechanisms for sharing physical memory between processes to save physical memory. If you know COW (Copy on Write), even better. There are multiple containers running on a physical machine, and the images of the containers are actually hierarchical. The images of different services generated by the same organization are often based on the same base layer, and this base layer includes Java-related libraries. The so-called layer is nothing but a directory on the host. That is, different containers may share the same file for reading (Mapping). Back to our topic, memory limitation. The container limits memory through cgroups. The cgroup will account for each memory allocation of the process in the container. The calculation method of file mapping shared memory obviously needs special treatment, because it crosses processes and containers. The information that can be found now is that only the first cgroup that reads/writes this mapping memory is accounted for ( https://www.kernel.org/doc/Documentation/cgroup-v1/memory.txt [2.3 Shared Page Accounting]). Therefore, this account is more difficult to predict. Generally, we only make reservations for the worst. The accounting principle is similar to However, after Java 9, .jar mapping is no longer done. Even Java 8 is only part of the directory structure in the mapping file. In my test, only 8Mb of memory was used. Java uses glibc malloc in two situations: The industry Unfortunately, my test environment is a bare machine, and all CPUs are seen by the container. The host has 80 CPUs. So the question is, how to measure how much wasted? Output: So the result is: 638345216-472750720 = 165594496 ~= 158Mb One thing that needs to be pointed out is that the physical memory allocation of the operating system is allocated by Lazy, that is, it is allocated only when the memory is actually read and written. Therefore, the above 158Mb may be smaller from the RSS of the operating system. not investigated not investigated RSS(pmap -X $PID) = 3920MB. That is, the operating system thinks that 3920MB of physical memory is used. cgroup limit 4Gi = 4*1024Mb = 4096Mb Let's take a look at the Careful as you will find: No, why not OOM killed? To make a long story, pagecache is a flexible memory space. When an application needs anonymous memory, the kernel can automatically reclaim pagecache. Default This will use a large number of Direct Byte Buffers when the memory is not reclaimed in time when high concurrency occurs. So it is recommended to set the limit explicitly: 💡 1615eb71ccdc06 interested, please refer to: In my test environment, the host has 80 CPUs. In order to reduce the lock contention when multithreading allocates memory, glibc reserves up to 8 memory blocks ( The connection with memory usage: Contact with container cpu limit: cpu * (8 arena per cpu) = 64 Arena. We use large reserved spaces conservatively: After investigation, each API call takes about 100 ms. The existing configuration specifies a maximum of 200 threads. so: In our test, the TPS of a single container did not produce 1000. So 100 threads are enough. The advantage of reducing the number of threads is that it can reduce excessive thread context switching, cgroup CPU throttling, thread stack memory, and Native Buffer memory at the same time. Let the request heap in the Request Queue instead of the kernel's Runnale Queue. In our test, after the system warms up, the Java code cache will still increase slowly. The maximum code cache of Java 8 is 240Mb. If the code cache consumes a lot of memory, it may trigger OOM killed. So it is still necessary to make explicit restrictions. From the observation of the test environment, 100Mb of space is sufficient. From the above investigation, we can see that The cgroup has a record of the number of times the container is close to OOM (memory.failcnt), and it is found that this number is slowing during the test. When the memory is tight, the kernel will give priority to meeting the application's memory requirements by discarding the pagecache. And what does it mean to discard the file cache? Slower reads, more frequent and slower writes to the hard drive. If the application has read and write IO pressure, if you read *.jar and write logs, then the IO slow problem will follow. For my application, my suggestion is to relax the memory limit: Incompletely speaking, from the perspective of service operators, service is based on these coefficients : SLA of the container If I take the above coefficient as the input How should the resource configuration of each container be CPU Memory Application thread pool d limit: Every coin has two sides, and application tuning is that every tuning method has its required environmental prerequisites, otherwise it will not be called tuning, and directly go to the default configuration Pull Request of the open source project. Masters often say, don’t just copy and adjust the parameters. You must consider your own actual situation, and then do a sufficient test before you can use it. Beginning in 2016, major companies began to catch up with fashion and put appropriate applications into containers. And because many old projects and components were designed without considering running in a restricted container, to put it bluntly, they are not contaier aware. After a few years, the situation has improved, but there are still many pitfalls. As a qualified architect, in addition to PPT and the distance, we have to have a glass heart. The above is an analysis of the memory of a Java container. If you are interested in the CPU and thread parameters of the Java container, please move to: The historical pit of Java containerization (historical pit) limitation chapter 1615eb71cce351. Conclude this article with a comic:
[Image source: Introduction introduce
On the contrary, the operating system is a vigorous commander. Whenever a process is overrun, he will shoot OOM Killed directly. or you have studied cgroup memory in depth, it actually also has a Backpressure notification mechanism, but the current container and JVM ignore it.
test environment
主机:裸机(BareMetal)
CPU: 40 cores, 共 80 个超线程
Linux:
  Kernel: 5.3.18
  glibc: libc-2.26.so
Java: 1.8.0_261-b12
Web/Servlet 容器: Jetty
Configuration capacity
POD capacity configuration
    resources:
      limits:
        cpu: "8"
        memory: 4Gi
        # 4Gi = 4 * 1024Mb = 4*1024*1024k = 4194304k = 4294967296 bytes = 4096Mb
      requests:
        cpu: "2"
        memory: 4Gi
JVM capacity configuration
picture Source: https://docs.oracle.com/javase/8/docs/technotes/tools/unix/java.html as it says:Sets the maximum total size (in bytes) of the New I/O (the java.nio package) direct-buffer allocations. Append the letter k or K to indicate kilobytes, m or M to indicate megabytes, g or G to indicate gigabytes . By default, the size is set to 0, meaning that the JVM chooses the size for NIO direct-buffer allocations automatically.
Arthas attached to the JVM and then view the internal static variables:[arthas@112]$ dashboard
ognl -c 30367620 '@io.netty.util.internal.PlatformDependent@maxDirectMemory()'
@Long[3,221,225,472]
ognl '@java.nio.Bits@maxMemory'
@Long[3,221,225,472]MaxDirectMemorySize ~= `from -Xmx (Young Heap + Old Heap )` - `Survivor(Young) Capacity` ~= 3GmaxThreadCount Maximum number of threads sourceArthas used above, let’s continue with Arthas :[arthas@112]$ dashboard
Threads Total: 276jetty-threadpool.xml<Configure>
<New id="threadPool" class="org.eclipse.jetty.util.thread.QueuedThreadPool">
<Set name="maxThreads" type="int"><Property name="jetty.threadPool.maxThreads" deprecated="threads.max" default="200"/></Set>
...
</New>
</Configure>Usage amount
Viewing usage from the perspective of Java
Capacity allocation Effective configuration (Mbyte) Actual use (Mbyte) Young Heap + Old Heap -Xmx3G -XX:+AlwaysPreTouch3072 3072 MaxMetaspaceSize [default] Unlimited 128 CompressedClassSpaceSize [default] 1024 15 MaxDirectMemorySize [default] 3072 270 ReservedCodeCacheSize [default] 240 82 ThreadStackSize*maxThreadCount [Default]*276 threads 276 276 Sum 7684 + (Unlimited MaxMetaspaceSize) 3843 How to collect the actual usage of
Arthas attached:[arthas@112]$ dashboard
code_cache : 82Mb[arthas@112]$
ognl '@java.nio.Bits@reservedMemory.get()'
@Long[1,524,039]
ognl -c 30367620 '@io.netty.util.internal.PlatformDependent@usedDirectMemory()'
@Long[268,435,456]$ jcmd $PID GC.heap_info
garbage-first heap total 3145728K, used 1079227K [0x0000000700000000, 0x0000000700106000, 0x00000007c0000000)
region size 1024K, 698 young (714752K), 16 survivors (16384K)
Metaspace used 127,323K, capacity 132,290K, committed 132,864K, reserved 1,167,360K
class space used 14,890K, capacity 15,785K, committed 15,872K, reserved 1,048,576KLook at usage from the perspective of native apps
Usage from Java perspective: 3843Mb
Total application usage = 3843 + 158 ~= 4001Mb *lib.so dynamic library occupancy and *.jar file mapping occupancy. Why? It will be explained in the following.
The number of 4001Mb is a bit scary, not far from the upper limit of the container configuration of 4096Mb. But this number has some moisture. Why? It will be explained in the following.*lib.so dynamic library occupation
pmap -X $PID Address Perm Offset Device Inode Size Rss Pss Referenced Anonymous Mapping
...
7f281b1b1000 r-xp 00000000 08:03 1243611251 48 48 3 48 0 /lib64/libcrypt-2.26.so
7f281b1bd000 ---p 0000c000 08:03 1243611251 2044 0 0 0 0 /lib64/libcrypt-2.26.so
7f281b3bc000 r--p 0000b000 08:03 1243611251 4 4 4 4 4 /lib64/libcrypt-2.26.so
7f281b3bd000 rw-p 0000c000 08:03 1243611251 4 4 4 4 4 /lib64/libcrypt-2.26.so
...
7f28775a5000 r-xp 00000000 08:03 1243611255 92 92 5 92 0 /lib64/libgcc_s.so.1
7f28775bc000 ---p 00017000 08:03 1243611255 2048 0 0 0 0 /lib64/libgcc_s.so.1
7f28777bc000 r--p 00017000 08:03 1243611255 4 4 4 4 4 /lib64/libgcc_s.so.1
7f28777bd000 rw-p 00018000 08:03 1243611255 4 4 4 4 4 /lib64/libgcc_s.so.1
7f28777be000 r-xp 00000000 08:03 1800445487 224 64 4 64 0 /opt/jdk1.8.0_261/jre/lib/amd64/libsunec.so
7f28777f6000 ---p 00038000 08:03 1800445487 2044 0 0 0 0 /opt/jdk1.8.0_261/jre/lib/amd64/libsunec.so
7f28779f5000 r--p 00037000 08:03 1800445487 20 20 20 20 20 /opt/jdk1.8.0_261/jre/lib/amd64/libsunec.so
7f28779fa000 rw-p 0003c000 08:03 1800445487 8 8 8 8 8 /opt/jdk1.8.0_261/jre/lib/amd64/libsunec.so
...
7f28f43a7000 r-xp 00000000 08:03 1243611284 76 76 3 76 0 /lib64/libresolv-2.26.so
7f28f43ba000 ---p 00013000 08:03 1243611284 2048 0 0 0 0 /lib64/libresolv-2.26.so
7f28f45ba000 r--p 00013000 08:03 1243611284 4 4 4 4 4 /lib64/libresolv-2.26.so
7f28f45bb000 rw-p 00014000 08:03 1243611284 4 4 4 4 4 /lib64/libresolv-2.26.so
7f28f45bc000 rw-p 00000000 00:00 0 8 0 0 0 0
7f28f45be000 r-xp 00000000 08:03 1243611272 20 20 1 20 0 /lib64/libnss_dns-2.26.so
7f28f45c3000 ---p 00005000 08:03 1243611272 2044 0 0 0 0 /lib64/libnss_dns-2.26.so
7f28f47c2000 r--p 00004000 08:03 1243611272 4 4 4 4 4 /lib64/libnss_dns-2.26.so
7f28f47c3000 rw-p 00005000 08:03 1243611272 4 4 4 4 4 /lib64/libnss_dns-2.26.so
7f28f47c4000 r-xp 00000000 08:03 1243611274 48 48 2 48 0 /lib64/libnss_files-2.26.so
7f28f47d0000 ---p 0000c000 08:03 1243611274 2044 0 0 0 0 /lib64/libnss_files-2.26.so
7f28f49cf000 r--p 0000b000 08:03 1243611274 4 4 4 4 4 /lib64/libnss_files-2.26.so
7f28f49d0000 rw-p 0000c000 08:03 1243611274 4 4 4 4 4 /lib64/libnss_files-2.26.so
7f28f49d1000 rw-p 00000000 00:00 0 2072 2048 2048 2048 2048
7f28f4bd7000 r-xp 00000000 08:03 1800445476 88 88 6 88 0 /opt/jdk1.8.0_261/jre/lib/amd64/libnet.so
7f28f4bed000 ---p 00016000 08:03 1800445476 2044 0 0 0 0 /opt/jdk1.8.0_261/jre/lib/amd64/libnet.so
7f28f4dec000 r--p 00015000 08:03 1800445476 4 4 4 4 4 /opt/jdk1.8.0_261/jre/lib/amd64/libnet.so
7f28f4ded000 rw-p 00016000 08:03 1800445476 4 4 4 4 4 /opt/jdk1.8.0_261/jre/lib/amd64/libnet.so
7f28f4dee000 r-xp 00000000 08:03 1800445477 68 64 4 64 0 /opt/jdk1.8.0_261/jre/lib/amd64/libnio.so
7f28f4dff000 ---p 00011000 08:03 1800445477 2044 0 0 0 0 /opt/jdk1.8.0_261/jre/lib/amd64/libnio.so
7f28f4ffe000 r--p 00010000 08:03 1800445477 4 4 4 4 4 /opt/jdk1.8.0_261/jre/lib/amd64/libnio.so
7f28f4fff000 rw-p 00011000 08:03 1800445477 4 4 4 4 4 /opt/jdk1.8.0_261/jre/lib/amd64/libnio.so💡 If you don't know much about the output of Linux memory map and pmap, I suggest reading: https://www.labcorner.de/cheat-sheet-understanding-the-pmap1-output/ .
If you are as lazy as I am, let me take the previous picture:*.jar mapping occupied
pmap -X $PIDglibc malloc consumption
glibc malloc the waste of 0615eb71ccd8bf. The main focus is on the untimely return of memory (to the operating system). This waste is proportional to the number of CPUs of the host. Refer to:glibc provides a malloc_stats(3) function, which will output heap information (including use and reservation) to the standard output stream. Then the problem comes again. How to call this function? Modify the code and write JNI? sure. However, as a Geek, of course you must use gdb .cat <<"EOF" > ~/.gdbinit
handle SIGSEGV nostop noprint pass
handle SIGBUS nostop noprint pass
handle SIGFPE nostop noprint pass
handle SIGPIPE nostop noprint pass
handle SIGILL nostop noprint pass
EOF
export PID=`pgrep java`
gdb --batch --pid $PID --ex 'call malloc_stats()'Arena 0:
system bytes = 135168
in use bytes = 89712
Arena 1:
system bytes = 135168
in use bytes = 2224
Arena 2:
system bytes = 319488
in use bytes = 24960
Arena 3:
system bytes = 249856
in use bytes = 2992
...
Arena 270:
system bytes = 1462272
in use bytes = 583280
Arena 271:
system bytes = 67661824
in use bytes = 61308192
Total (incl. mmap):
system bytes = 638345216
in use bytes = 472750720
max mmap regions = 45
max mmap bytes = 343977984
That is, 158Mb was wasted. Because the load in my test scenario is not heavy, under heavy load and high concurrency scenarios, the waste of 80 CPUs is much more than that.GC memory consumption
tmpfs memory consumption
Operating System RSS
CGroup restrictions
pagecache free space: 4096-3920 = 176Mbmemory.stat file of cgroup$ cat cgroup `memory.stat` file
rss 3920Mb
cache 272Mb
active_anon 3740Mb
inactive_file 203Mb
active_file 72Mb # bytes of file-backed memory on active LRU list3920 + 272 = 4192 > 4096Mb💡 interested can refer to:
https://engineering.linkedin.com/blog/2016/08/don_t-let-linux-control-groups-uncontrolled
https://github.com/kubernetes/kubernetes/issues/43916
https://www.kernel.org/doc/html/latest/admin-guide/cgroup-v1/memory.htmlPotential problems and recommended solutions
Native Buffer limitations
MaxDirectMemorySize ~ = -Xmx - survivor size ~ = 3G.java ... -XX:MaxDirectMemorySize=350MbCassandra client and Redisson are based Netty , solid are used Native Buffer . Note that Netty in Unsafe.class basis, as well as internal memory pool.glibc malloc
arena wasteArena ) Arena is returned to the operating system is unpredictable, and memory fragmentation in the heap And so on.
The result observed in my test environment is: a total of 271 Arena been created. 608Mb RSS is used. The actual memory used by the program is only 450Mb. wasted 157 Mb . The waste is random and related to memory fragmentation. For containers, it is impossible to allocate CPUs for all hosts. It is reasonable to set an explicit upper limit, and this upper limit should be linked with the memory limit and CPU limit of the container.MALLOC_ARENA_MAX is used to configure this upper limit.
In our actual measurement, a total of 700Mb of glibc heap memory was used. And the Arena is 64Mb. So:700/64=10 Arenaexport MALLOC_ARENA_MAX=64💡 interested can refer to:
https://www.gnu.org/software/libc/manual/html_node/Memory-Allocation-Tunables.htmlJetty thread pool
200 thread / 0.1s = 2000 TPS<!-- jetty-threadpool.xml -->
<Configure>
<New id="threadPool" class="org.eclipse.jetty.util.thread.QueuedThreadPool">
...
<Set name="maxThreads" type="int"><Property name="jetty.threadPool.maxThreads" deprecated="threads.max" default="100"/></Set>
...
</New>
</Configure>Java code cache is rising slowly
java ... -XX:ReservedCodeCacheSize=100M -XX:UseCodeCacheFlushing=true💡 interested can refer to:
https://docs.oracle.com/javase/8/embedded/develop-apps-platforms/codecache.htmThe memory limit of the container
3G java heap + JVM overhead + DirectByteBuffer is very close to the container memory upper limit of 4Gi In the case of high concurrency, the risk of OOM killed is still very high. And this problem may not appear in the test environment, it has its randomness.watch cat ./memory.failcnt
19369💡 interested can refer to:
https://engineering.linkedin.com/blog/2016/08/don_t-let-linux-control-groups-uncontrolled
https://www.kernel.org/doc/Documentation/cgroup-v1/memory.txt
https://srvaroa.github.io/jvm/kubernetes/memory/docker/oomkiller/2019/05/29/k8s-and-java.html resources:
limits:
memory: 4.5Gi
requests:
memory: 4.5GiOutlook
a tool program, then the output of should be:💡 There is an open source tool for reference:
https://github.com/cloudfoundry/java-buildpack-memory-calculatorDisclaimer
Experience


**粗体** _斜体_ [链接](http://example.com) `代码` - 列表 > 引用。你还可以使用@来通知其他用户。