
Preface
Recently, I restarted reading the book "In-Depth Understanding of the Java Virtual Machine", thinking about using a series of articles to record and share my experience. Why do you want to say "re"? It's because I bought this book many years ago and I have read it over and over again. This "over and over" can be said to be a very vivid image, because I not only read the book from the front to the back, but also from the back to the front. However, this is not a process to be proud of, because I was often stuck when I watched it before (commonly known as incomprehensible), which caused me to give up halfway. When I picked it up again, I tried to look from the back to the front in order to have more freshness. It turns out that the effect is still not good. This year, I picked up this book again (forced by life), and after reading it this time, it is much smoother than before, probably because I have some work experience (social beating). There are several reasons why I feel that this book is difficult to keep reading:
- There are some requirements for basic computer skills
This book is actually not recommended for junior developers, because it assumes that readers have already understood many basic knowledge in the computer field, including operating systems, data structures, compilation principles, etc., and requires some source code reading capabilities (here The source code is not JAVA, but C or assembly language). If you don’t have a preliminary understanding of these, it’s easy to be taken away by the book-filled terminology (I know every word in the legend, but I don’t know what the sentence is saying, I understand this feeling~), and finally from Getting started is going to give up. - There are not many opportunities encountered in the real development process
JVM is like a stove to a chef to a JAVA engineer (we may not be as familiar with the JVM as a chef). Everyone knows to use it, and it rarely causes problems, but once there is a problem, we start to be dumbfounded. This also made it difficult for me to empathize with many examples when I first read this book. In addition, there are not many practical opportunities, and I can't learn and use them flexibly. But once you get to work, the probability of JVM problems increases (although still not many). When the system frequently reports that the memory usage is too high or the OOM is abnormal, we may need to take out this book to cool down the busy system. - Not enough to pursue the ultimate
In fact, what touched me the most in the book is that the author recorded the actual optimization of the Eclipse virtual machine. As mentioned above, there are not many scenarios where JVM optimization is used, but in turn, I wonder if this is because we are not pursuing the ultimate. Can the compilation speed of the code be improved? Can the system start-up time be shortened? Can the Full GC frequency be reduced? The author used Eclipse at the time to start up and it was not bad, but he still found this optimization scenario, and flexibly used JVM knowledge to achieve the desired effect. Now that the system can be used, it might as well make it better. Pursuing the extreme is the best quality to promote the growth of programmers~
So now that this book is already very good, what is the purpose of this series of articles? There are two main ones:
- Lower the barrier to reading
The above-mentioned related knowledge that needs to be known in advance before reading this book will be introduced in this series of articles. It won't be so in-depth, but it can make everyone's reading more coherent. - Share reading experience
I have posted on many forums how to learn JVM, but the feedback is very limited. I also saw the great god on the intranet share his bumpy experience of learning JVM, but my skill obviously does not allow me to rip the code directly. Therefore, I hope to extend the content of reading and consolidate my understanding through sharing. I also hope that you will give more feedback after reading the article. Whether it is a misunderstanding in the article or an example of optimization encountered in your work, you are always welcome.
Multithreading basic model
Before starting to introduce the JVM, let's take a brief look at the main parts of modern computers and the concept of multi-threaded operation.
The model of modern computer is mainly derived from the original von Neumann model, which is mainly composed of the following parts: CPU, memory, disk and IO device (only the most basic structure is given here).
Among them, the CPU is responsible for computing, and the memory and disk are responsible for storage. The difference between the two is whether the data can be persisted after a power failure. IO devices refer to all input and output devices, such as keyboards, displays, etc. With the development of computers, the performance of various hardware has been significantly improved, especially the computing power of the CPU. As a result, other operations, such as the read and write capabilities of the disk, have become a bottleneck (it can be understood as the time-consuming of one read and write, which can calculate thousands of CPU instructions). Therefore, the operating system introduced a multi-process model, and subsequently introduced a multi-threaded model, that is, when one of the processes/threads performs operations that take a long time and does not require CPU involvement, such as reading a file, release the CPU to Used by another process/thread. As for whether it is multi-process concurrency or multi-thread concurrency, it depends on the specific operating system design. Some operating systems can only allocate CPU time according to threads, and need to continue slicing time to threads within the process. The overall relationship between processes, threads, and CPUs is as follows. The green ones represent the threads that currently obtain the CPU clock and execute them.


The process of Java from code to running
Then we look at how the code changes from the high-level development languages we saw (such as Java, C++, etc.) into executable computer instructions. As we all know, it is impossible for a computer to understand the semantics of every different high-level development language. It can only understand machine language, such as adding the value of memory location A to 1, or reading the value of memory location B and putting it into the accumulator. . Therefore, it is necessary to use some tool to escape the high-level development language into instructions that the machine can understand. And this conversion process can be divided into compilation type and interpretation type.
Interpreted languages are compiled into machine executable instructions when they are run. Common interpreted languages include python, perl, etc. Compiled languages will first compile high-level languages into executable instruction products, and then run them. Therefore, relatively speaking, a time-consuming compilation will increase first, but the compiled products can be executed repeatedly. JAVA is a compiled language.
However, compared with traditional compiled languages such as C, JAVA has more interpretation steps. Its compiled product is not an executable file, but a bytecode file (.class file), and then the bytecode file is interpreted through the JVM. Run for executable machine instructions. It is this step that makes Java a language that supports cross-platform operation, because it only needs to be compiled once, and its compiled products can be run on various platforms. Of course, this also means that the JVM needs to be customized for different platforms.

JVM runtime data area
After introducing the process of Java from code to running, we understand that JVM is responsible for interpreting .class files into machine instructions and executing them during the entire life cycle. Since it acts as an intermediary to carry the operation of the program, it also needs to interact with and manage the various components of the computer. And this article will introduce how the JVM divides and manages the memory area.
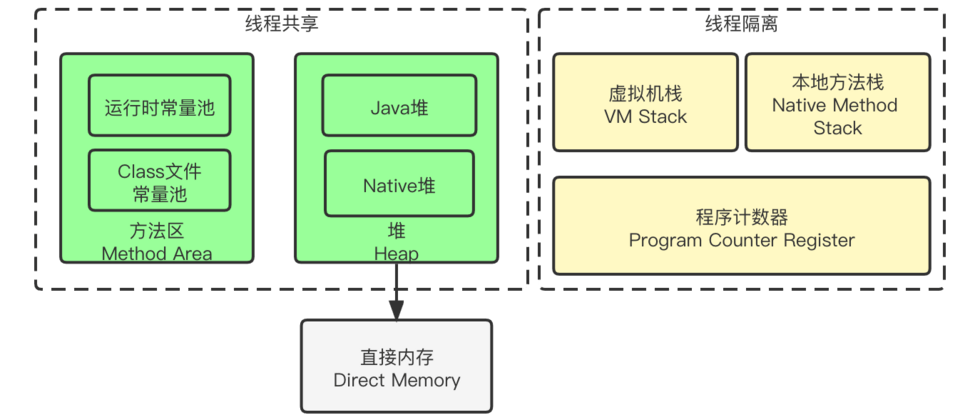
As shown in the figure below, the JVM further differentiates the divided memory according to the type of data stored, and divides the following areas: program counter, Java virtual machine stack, local method stack, Java heap, and method area.

Each area here stores different types of data, and different memory recovery mechanisms are adopted according to the characteristics of the data. (Memory reclamation is not the content of this section, but understanding the characteristics of the area will effectively help understand why the corresponding memory reclamation strategy is adopted)
Program counter
The program counter is not a unique attribute of the JVM. In fact, the concept of the program counter also exists in the operating system. The functions of the two in the program execution are actually similar.
As mentioned above, today's operating systems are multi-threaded in parallel, each thread will perform the work that the current thread needs to complete when it obtains the CPU clock, and perform a new round of preemption and allocation after the end of the clock cycle. This also means that threads that have not obtained clock cycles need to be interrupted and wait for the next time slice. Therefore, each thread needs to record the current execution progress, so that execution can be resumed when the CPU clock is regained. The JVM program counter is used to record the next bytecode instruction that needs to be executed (note that this is a bytecode instruction, and what is recorded in the program count of the operating system is the machine instruction)
Since each thread has its own independent program counter (it must not be shared here, otherwise it will become A thread executes B thread instructions when it gets the CPU clock), so this piece of memory is thread private memory.
Java virtual machine stack
The Java virtual machine stack describes the memory model of Java method execution. Here can briefly introduce the memory model of method execution. Let us first review the methods in Java.
public class Dog {
    private int weight;

    public void eat(Food f) {
        f.consume();
        Poop poop = new Poop();
        weight++;
    }
}

public class Food {
    private int bones;
    public void consume() {
        bones--;
    }
}
Each Java method contains method name, input parameters and return value (may be void), and then other methods, local variables or global variables may be accessed in the method. Take the code in the above article as an example, if we call new Dog().eat(new Food()) , the eat method will first call the consume method in the object f. This method will access the member variable bones and reduce its value by one, and then the eat method will access its own member variable weight and Increase its value by one. If you know the data structure stack, you can imagine the whole process as a stacking and popping.
Every time a Java method is accessed, a stack frame is created in the local method stack, and the local variable table, operand stack, dynamic link, method exit and other information are stored in the stack frame. After the method is executed, the life cycle of the stack frame also ends. This can also explain why the instance created inside the method is thread-safe (provided that the instance will not be returned by the method or its reference is outside the method area).
Here are some more concepts mentioned above: local variable table, operand stack and dynamic link .
local variable table will save the function parameters, local variables and returnAddress types. Take the pseudo code above as an example, when the eat method is called, its local variable table will contain the method parameters f and the objects created in the method poop , of course, because Food and Poop are objects, what is stored here are actually references to these two objects. Because this method has no return value, the returnAddress type is void. The size of the local variable table can be determined during code compilation (for those who are not familiar with compilation, refer to the Java code execution flow chart above)
operand stack , as the name suggests, is a stack data structure, which is used to save the intermediate results of the calculation process, and at the same time as a temporary storage space for variables in the calculation process. I don’t know if you have ever written the use of stacks to implement complex four arithmetic problems (very interesting topics, perfect use of the characteristics of the stack last in, first out), here the function of the operand stack is similar to it, but the completed operation is not only Four arithmetic, there are other instructions, such as calling other methods and saving the return value. Similarly, the memory size required by the operand stack can also be determined at compile time.
dynamically links to the runtime constant pool of the class where the current method is located, so that if you need to call other methods in the current method, you can find the corresponding symbol reference from the runtime constant pool, and then convert the symbol reference to a direct reference. Then you can directly call the corresponding method. In other words, if the current method needs to call other objects or methods, you need to know where they are in memory. The dynamic link records this information and converts it into a memory location and accesses it when needed.
There may be two exceptions in the Java virtual machine stack, StackOverflowError and OutOfMemoryError. The former is that the stack depth requested by the thread is greater than the depth allowed by the virtual machine, which is common in infinite loops caused by calling methods in a loop. The latter may occur when there are too many threads, resulting in insufficient memory allocation to meet demand.
As its function shows, the Java virtual machine stack is thread-private memory, and the A thread cannot access the contents of the B thread virtual machine stack.
Native method stack
The function of the native method stack is similar to that of the Java virtual machine stack. The difference is that instead of calling a Java method, it is a Native method. Native methods are usually not implemented in Java language, but are usually implemented in C/C++. The JVM specification does not require the use of specific languages to implement Native methods.
But not all virtual machines divide the method stack into a Java virtual machine stack and a local method stack. For example, Sun's Hotspot virtual machine combines the two stacks into one for unified management.
Java heap
The Java heap stores the object and the array , which is also the largest area of memory management, and this area is shared by threads (it is also an area that requires us to pay attention to concurrency control when programming). When a method creates an object or passes an object, it actually passes a reference to the object. This reference will point to the starting address of the object or a location related to the object.
The Java heap can also be divided into the young generation and the old generation, which are distinguished by the lifetime of the object. At the same time, the new generation can also be divided into Eden space, From Survivor space, To Survivor space, this is mainly for better completion of garbage collection. After the object is created, it will gradually move to the corresponding area as it is recycled. The specific number of times that it will enter the corresponding area after recycling is determined by the configuration of the JVM.

There is also an area not mentioned before in the figure: the permanent generation. This area usually stores some rarely changed information such as the content of the method area mentioned later, so its characteristics are not suitable for the Java heap. This area is also reclaimed during memory reclamation management.
Method area
The method area is also a memory area shared by each thread, which is used to store data such as class information, constants, static variables, and instant compiled code that have been loaded by the virtual machine. It can be seen that this type of data usually rarely changes, so some virtual machines treat it as a permanent JVM for management. And this piece of memory reclamation means the reclamation of the constant pool and the unloading of types (the conditions for type unloading in real time are very high, so most classes will not be unloaded. This is for those projects that like to use dynamic agents. It is said that this piece of memory is likely to have a memory overflow)
Here again, explain the concept just-in-time compiled code As mentioned above, the running process of Java is realized by JVM interpreting bytecode. However, every line of code that is run needs to be explained first and then executed, which will inevitably have an impact on performance. Therefore, some optimizations have been made inside the JVM, and frequently executed code blocks will be converted into machine instructions and saved, so that there is no need to explain it next time it is executed, which greatly improves the performance. This process is called Just In Time Compiler, and the machine instructions compiled by JIT will be stored in the method area.
Summarize
Here is a summary of the functions of each area and possible exceptions during JVM memory management.


**粗体** _斜体_ [链接](http://example.com) `代码` - 列表 > 引用。你还可以使用@来通知其他用户。