In daily work, we often encounter the need to draw sequence diagrams and flowcharts. When the requirements are not high, we can choose tools such as ProcessOn and Xmind to draw, but sometimes it may be more efficient to draw with code. After all, no one is more familiar with the code than the programmer. Today I recommend PlantUML, a drawing tool that can be used with IDEA, and drawing is more efficient!
1. Introduction to PlantUML
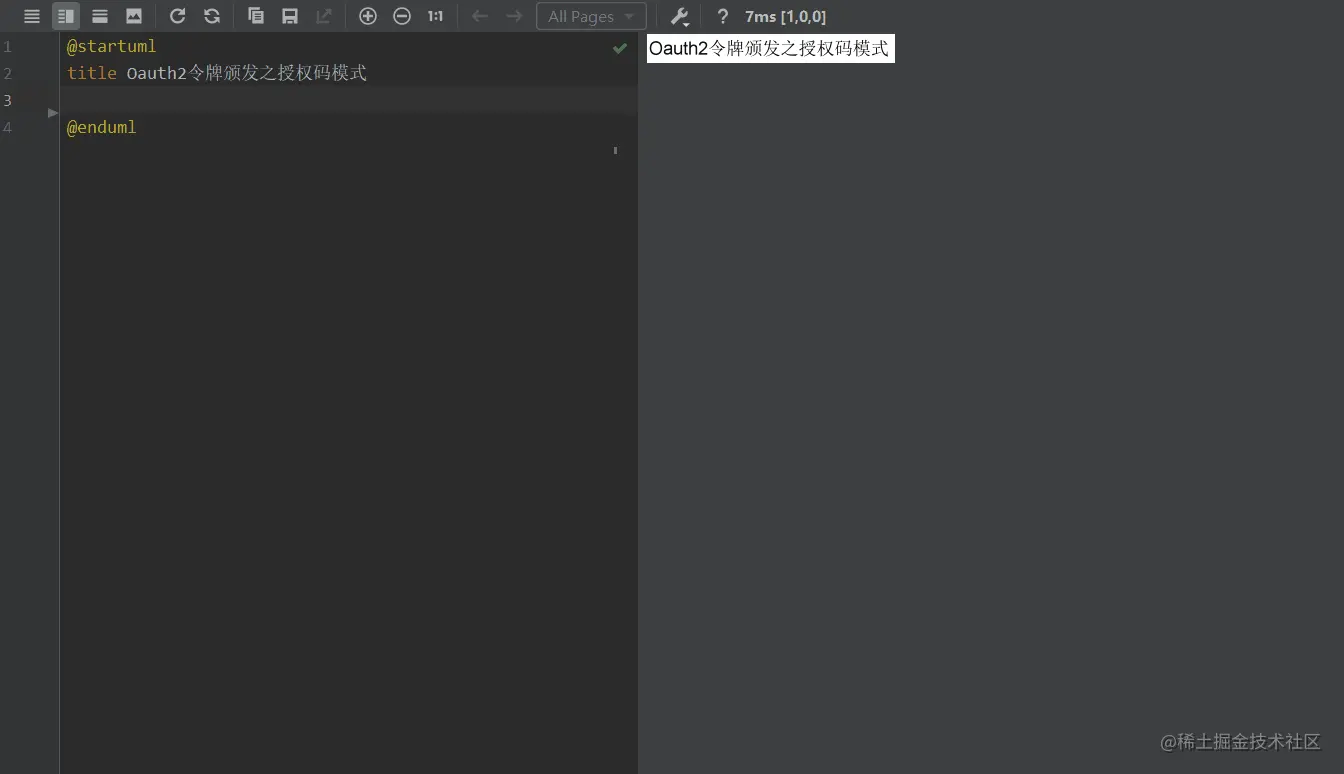
lantUML is an open source UML diagram drawing tool that supports the generation of graphics through text, which is very efficient to use. It can support the drawing of sequence diagrams, class diagrams, object diagrams, activity diagrams, mind maps and other graphics. The following is the use of PlantUML to draw a flowchart, which can be previewed in real time, and the speed is very fast!
2. Installation
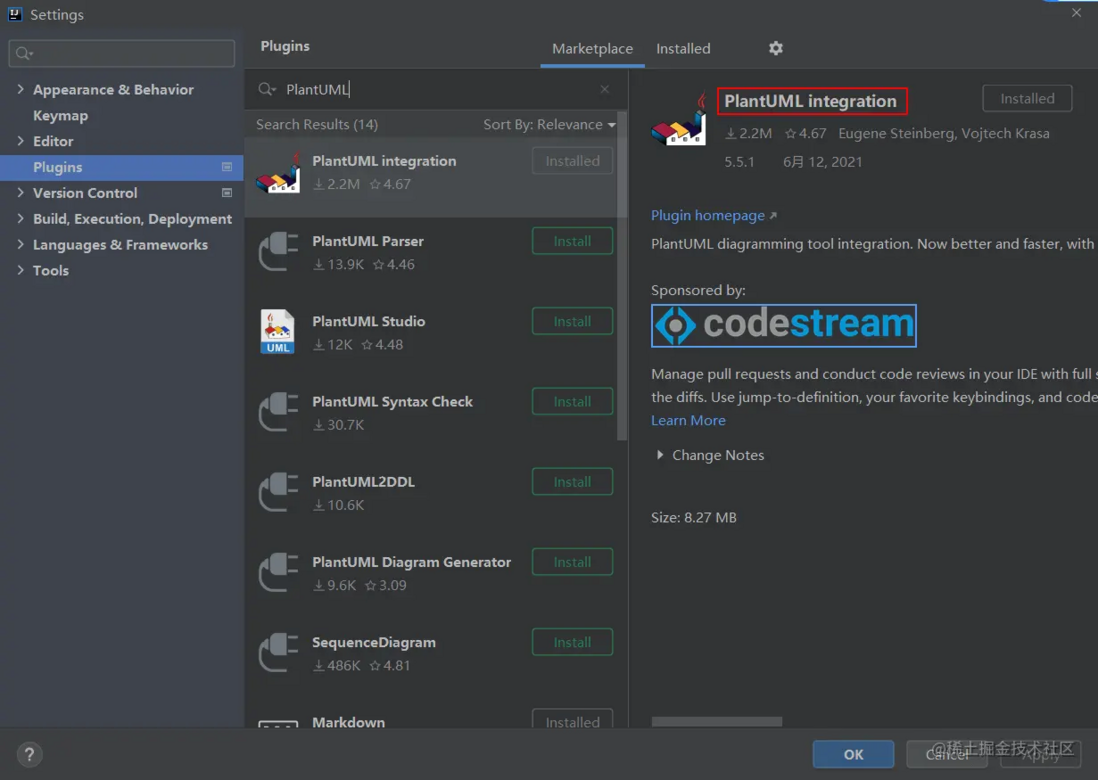
The installation method of PlantUML plug-in in IDEA is similar to that of other plug-ins. First, search for PlantUML in IDEA's plug-in market, and then install it.
Of course, when the network is not good, we can also click the Plguin homepage button to access the plug-in homepage, and then download it to the local for installation.
Three, use
Next, we look at how to use the PlantUML plug-in to draw sequence diagrams, use case diagrams, class diagrams, activity diagrams, mind maps, and some of their use skills.
3.1 Timing diagram
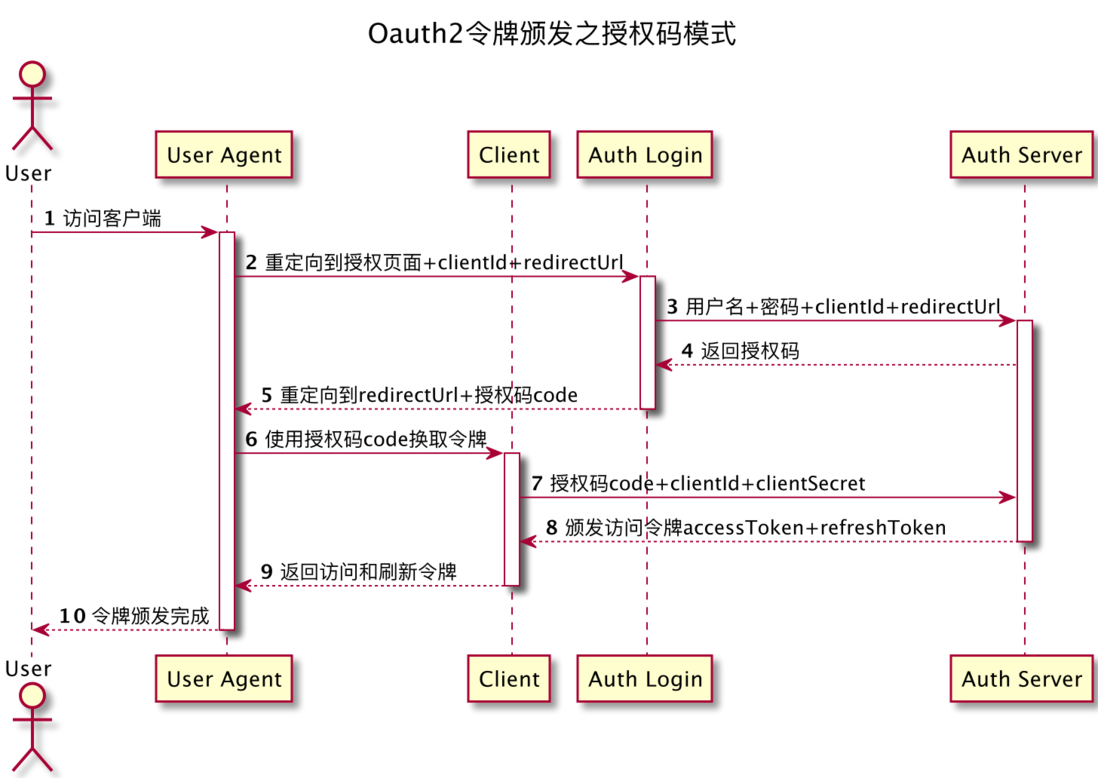
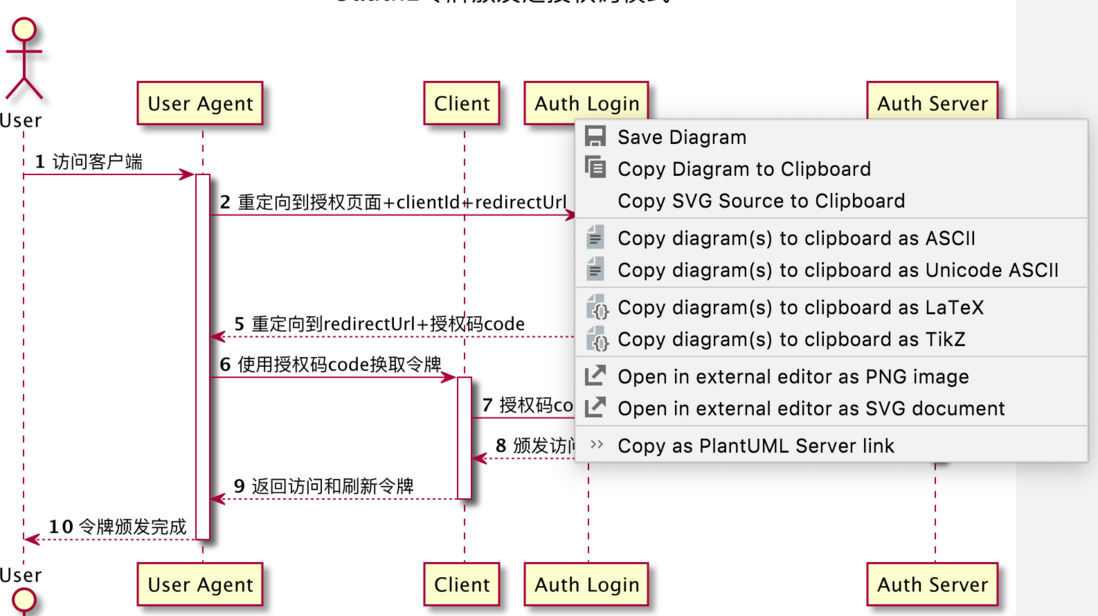
Sequence Diagram (Sequence Diagram) is a UML interaction diagram. It shows the dynamic collaboration between multiple objects by describing the time sequence of sending messages between objects. Usually, when the system is Oauth2, the first step is to understand the Oauth2 process. At this time, it is very necessary to have a sequence diagram. Below we use PlantUML to draw the sequence diagram of issuing tokens using authorization code mode in Oauth2.
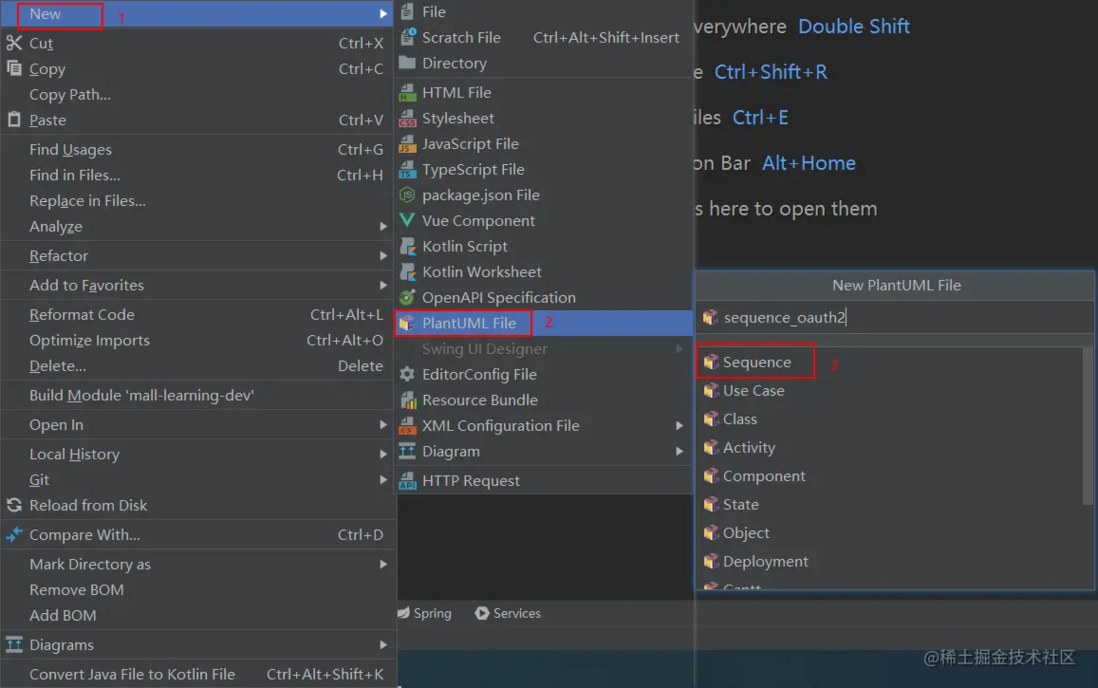
First, we need to create a new PlantUML file and select the sequence diagram, as shown in the figure below.
Next, we can generate Oauth2 sequence diagrams through the syntax provided by PlantUML.
@startuml
title Oauth2令牌颁发之授权码模式

actor User as user
participant "User Agent" as userAgent
participant "Client" as client
participant "Auth Login" as login
participant "Auth Server" as server

autonumber
user->userAgent:访问客户端
activate userAgent
userAgent->login:重定向到授权页面+clientId+redirectUrl
activate login
login->server:用户名+密码+clientId+redirectUrl
activate server
server-->login:返回授权码
login-->userAgent:重定向到redirectUrl+授权码code
deactivate login
userAgent->client:使用授权码code换取令牌
activate client
client->server:授权码code+clientId+clientSecret
server-->client:颁发访问令牌accessToken+refreshToken
deactivate server
client-->userAgent:返回访问和刷新令牌
deactivate client
userAgent--> user:令牌颁发完成
deactivate userAgent
@enduml
Then, on the right side of the IDEAL panel, the following sequence diagram will be generated correspondingly, is it cool?
The timing diagram has some important parameters explained as follows:
- title can be used to specify the title of the UML diagram;
- Actors can declare humanoid participants;
- Participants can declare common types of participants;
- as can give participants an alias;
- ->The relationship between participants can be drawn, and the dotted arrow can be used -->;
- After each participant relationship, you can use: add a description to the relationship;
- We can automatically add a serial number to the participant relationship;
- Activate and deactivate can specify the lifeline of the participant.
And, when we right-click the sequence diagram, we can also generate an online access link, as shown in the figure below.
You can directly access this link to access UML sequence diagrams and edit them online.
3.2 Use case diagram
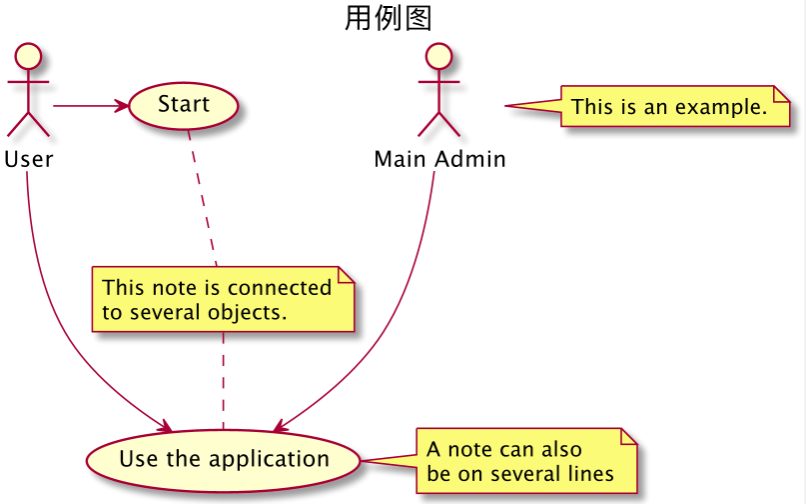
Usecase Diagram (Usecase Diagram) is the simplest representation of the interaction between the user and the system, mainly used to show the relationship between the user and his related use cases. Through the use case diagram, we can easily show the relationship between the various roles in the system and the use cases.
First, we need to create a new PlantUML file and select Use Case, as shown below.
@startuml
left to right direction
actor Guest as g
package Professional {
    actor Chief as c
    actor "Food Critic" as fc
}
package Restaurant {
    usecase "Eat Food" as uc1
    usecase "Pay For Food" as uc2
    usecase "Drink" as uc3
    usecase "Review" as uc4
}
g--> uc1
g--> uc2
g--> uc3
fc--> uc4
@enduml
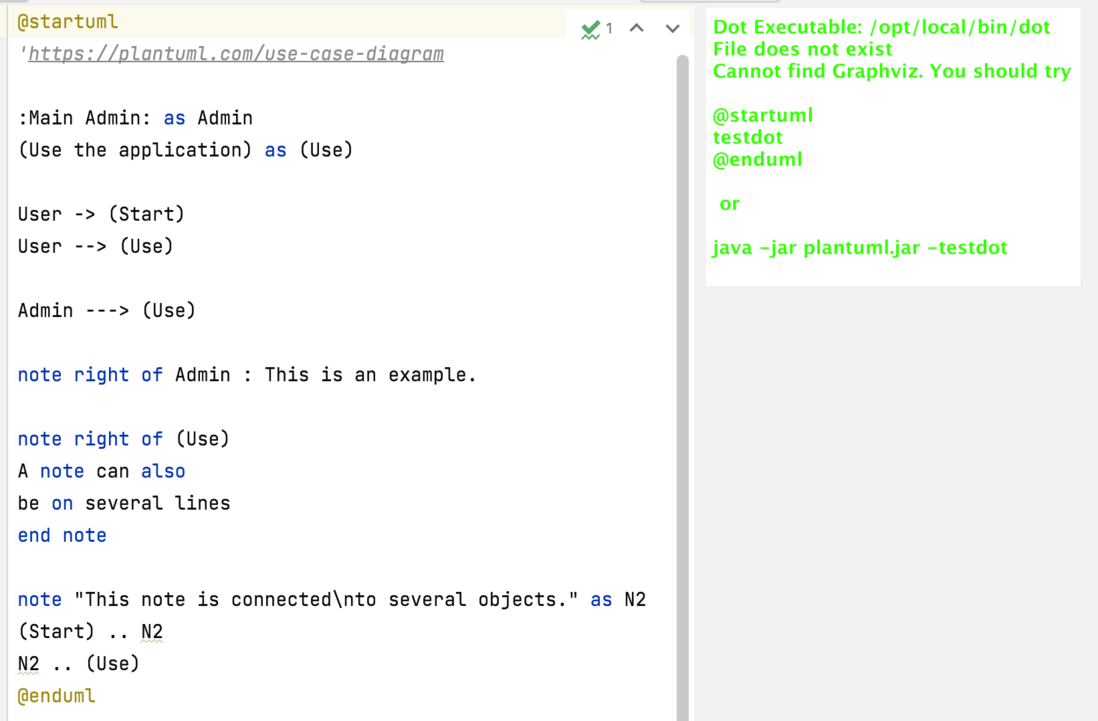
However, when running, there was an error as shown in the figure below.
The reason for this is that Graphviz is not installed. At this time, you only need to install Graphviz. The installation command is as follows.
brew install GraphvizThe use case diagram has some parameters explained as follows
- left to right direction indicates that the use case diagram is drawn in the order from left to right, the default is from top to bottom;
- Package can group roles and use cases;
- Actors can define users;
- usecase can define use cases;
- The relationship between roles and use cases can be represented by -->.
3.3 Class diagram
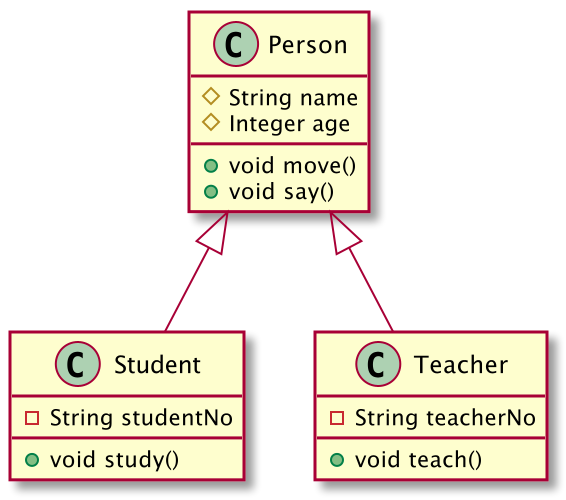
Class Diagram can represent the static structure of a class, such as the attributes and methods contained in the class, and the inheritance structure of the class.
First, we need to create a new PlantUML file and select the class diagram, as shown below.
@startuml
class Person {
    # String name
    # Integer age
    + void move()
    + void say()
}
class Student {
    - String studentNo
    + void study()
}
class Teacher {
    - String teacherNo
    + void teach()
}
Person <|-- Student
Person <|-- Teacher
@enduml
Then, you can see that the code generates the following class diagram.
Some key parameters of the class diagram are explained as follows:
- class can define a class;
- Add symbols to the left of properties and methods to define visibility,-means private, # means protected, + means public;
- Pass <|-- to indicate the inheritance relationship between classes.
3.4 Activity diagram
Activity Diagrams are usually used to represent business processes, such as the ordering process in e-commerce, such as the process of generating a confirmation in a shopping cart in an e-commerce project.
First, we need to create a new PlantUML file, select the activity diagram, and then add the following process control code.
@startuml
title 生成确认单流程
start
:获取购物车信息并计算好优惠;
:从ums_member_receive_address表中\n获取会员收货地址列表;
:获取该会员所有优惠券信息;
switch(根据use_type判断每个优惠券是否可用)
case(0)
    :全场通用;
    if (判断所有商品总金额是否\n满足使用起点金额) then (否)
        :得到用户不可用优惠券列表;
        stop
    endif
case(-1)
    :指定分类;
    if (判断指定分类商品总金额\n是否满足使用起点金额) then (否)
        :得到用户不可用优惠券列表;
        stop
    endif
case(-2)
    :判断指定商品总金额是否满足使用起点金额;
    if (判断指定分类商品总金额\n是否满足使用起点金额) then (否)
        :得到用户不可用优惠券列表;
        stop
    endif
endswitch
:得到用户可用优惠券列表;
:获取用户积分;
:获取积分使用规则;
:计算总金额,活动优惠,应付金额;
stop
@enduml
Then the code will generate the following activity diagram. In the activity diagram, we can use if else , switch , or even while loop.
Some descriptions of the activity diagram are as follows:
- start and stop can indicate the beginning and end of the process;
- :And; add text in the middle to define the activity process node;
if+then+endifdefines condition judgment;switch+case+endswitchdefines switch judgment.
3.5 Mind Map
Mind Map is an effective graphical tool for expressing divergent thinking. It is simple but very effective, and is a practical thinking tool.
First, we need to create a new PlantUML file and select the mind map.
@startmindmap
+[#17ADF1] mall学习路线
++[#lightgreen] 推荐资料
++[#lightblue] 后端技术栈
+++_ 项目框架
+++_ 数据存储
+++_ 运维部署
+++_ 其他
++[#orange] 搭建项目骨架
++[#1DBAAF] 项目部署
+++_ Windows下的部署
+++_ Linux下使用Docker部署
+++_ Linux下使用Docker Compose部署
+++_ Linux下使用Jenkins自动化部署
--[#1DBAAF] 电商业务
---_ 权限管理模块
---_ 商品模块
---_ 订单模块
---_ 营销模块
--[#orange] 技术要点
--[#lightblue] 前端技术栈
--[#lightgreen] 进阶微服务
---_ Spring Cloud技术栈
---_ 项目部署
---_ 技术要点
--[#yellow] 开发工具
--[#lightgrey] 扩展学习
@endmindmap
3.6 Deployment diagram
The deployment diagram (deployment diagram, configuration diagram) is used to show the physical architecture of the software and hardware in the system. From the deployment diagram, you can understand the physical relationship between the software and hardware components and the distribution of the components of the processing nodes. Use deployment diagrams to show the structure of the runtime system, while also conveying how the hardware and software elements that make up the application are configured and deployed.
@startuml
actor actor
agent agent
artifact artifact
boundary boundary
card card
cloud cloud
component component
control control
database database
entity entity
file file
folder folder
frame frame
interface  interface
node node
package package
queue queue
stack stack
rectangle rectangle
storage storage
usecase usecase
@enduml
Although there are many graphical tools that can draw UML diagrams, it may be more straightforward for programmers to use code to draw. The above only lists some common diagram scenarios. If you are interested in PlantUML, you can refer to PlantUML Chinese official website



**粗体** _斜体_ [链接](http://example.com) `代码` - 列表 > 引用。你还可以使用@来通知其他用户。