likes look again, the power is unlimited. Hello world search "161a58cbd9b06c 161a58cbd9b06e programmer Alang ".
This article Github.com/niumoo/JavaNotes and program Alang blog has been included, there are many knowledge points and series of articles.
The current article belongs to the Java performance analysis and optimization series of articles, click to view all articles.
This article is the article in the 161a58cbd9b135 Java performance analysis, monitoring and optimization series. It was originally planned to introduce Java performance analysis methods and popular monitoring tools. The taste is over. If you only use a certain tool without knowing the implementation principle behind it, you always feel a sense of strangeness. I think you are the same, so this article is more.
Java SE monitoring and management functions
This article introduces the monitoring and management technology provided by the Java Standard Edition (Java SE) platform- JMX (Java Management Extensions) technology.
The Java SE platform itself provides practical functional modules for monitoring and management services, which are mainly divided into the following four categories according to their functions:
- Java monitoring and management API
- Java virtual machine detection
- Java Management Extension Technology (JMX)
- Java monitoring and management tools
This article will introduce the relevant knowledge of these four parts, aiming to understand the related functions of Java SE monitoring and management, and have an understanding of the related concepts.
Java monitoring and management API
java.lang.management ) APIs for monitoring and management. These APIs can realize application self-monitoring. This API mainly provides access to the following information:
- Class loading related.
- JVM related, such as runtime, system environment variables, user input parameters.
- Thread related, such as thread status, thread statistics, thread stack, etc.
- Memory usage.
- GC situation.
- Deadlock detection.
- Operating system information.
The figure below is the java.management module in Java 17.
JConsole draws the interface version of monitoring by accessing the data provided by these management APIs.
Java virtual machine monitoring
As mentioned above, Java SE has built-in out-of-the-box monitoring and management functions. These functions can realize the self-monitoring of the program. Java has realized the monitoring of the relevant information of the Java virtual machine by default. In the Java monitoring and management API section It also lists some of the content that the API can monitor, so how to use it?
The following is a simple example to demonstrate how to obtain system information, compiler information, memory information, and garbage collector information through the monitoring management API.
package com.wdbyte;

import java.lang.management.CompilationMXBean;
import java.lang.management.GarbageCollectorMXBean;
import java.lang.management.ManagementFactory;
import java.lang.management.MemoryMXBean;
import java.lang.management.MemoryManagerMXBean;
import java.lang.management.MemoryUsage;
import java.lang.management.OperatingSystemMXBean;
import java.util.List;
import java.util.stream.Collectors;

public class JavaManagement {

    public static void main(String[] args) {
        OperatingSystemMXBean operatingSystemMXBean = ManagementFactory.getOperatingSystemMXBean();
        String osName = operatingSystemMXBean.getName();
        String osVersion = operatingSystemMXBean.getVersion();
        int processors = operatingSystemMXBean.getAvailableProcessors();
        System.out.println(String.format("操作系统:%s,版本:%s,处理器:%d 个", osName, osVersion, processors));

        CompilationMXBean compilationMXBean = ManagementFactory.getCompilationMXBean();
        String compilationMXBeanName = compilationMXBean.getName();
        System.out.println("编译系统:" + compilationMXBeanName);

        MemoryMXBean memoryMXBean = ManagementFactory.getMemoryMXBean();
        MemoryUsage heapMemoryUsage = memoryMXBean.getHeapMemoryUsage();
        long max = heapMemoryUsage.getMax();
        long used = heapMemoryUsage.getUsed();
        System.out.println(String.format("使用内存:%dMB/%dMB", used / 1024 / 1024, max / 1024 / 1024));

        List<GarbageCollectorMXBean> gcMXBeans = ManagementFactory.getGarbageCollectorMXBeans();
        String gcNames = gcMXBeans.stream()
            .map(MemoryManagerMXBean::getName)
            .collect(Collectors.joining(","));
        System.out.println("垃圾收集器:" + gcNames);
    }
}
When running, the memory is specified as 100MB ( -Xms100M -Xmx100M ), and the following results are obtained.
操作系统:Mac OS X,版本:11.6,处理器:12 个
编译系统:HotSpot 64-Bit Tiered Compilers
使用内存:2MB/100MB
垃圾收集:G1 Young Generation,G1 Old Generation
:::tip Note
A closer look at the code shows that many of the classes MXBean . What does this mean?
:::
Java Management Extension Technology (JMX)
In the code examples in the Java virtual machine monitoring, you can see many MXBean JMX (Java Management Extensions) technology has been involved here.
JMX technology provides a simple and standard way to manage resources, such as operating system, virtual machine information, memory status, thread information, etc. These are collectively referred to as managed resources. And JMX can be dynamic, so you can use JMX technology to monitor and manage various resources. You can use JMX technology to monitor the status of the Java virtual machine, or you can use JMX technology to build your own resources that need to be managed.
Is JMX technology only as simple as resource definition? no. JMX specification of the Java resource definition in a way, the way architecture resource management, monitoring and management, and related API to achieve specific design patterns, monitoring and management, and for remote network monitoring service (RMI), this The series of functions are collectively referred to as JMX technology. It is a standard part of the Java SE platform.
management resource has been mentioned many times above, so how to define a resource? JMX technology provides the architecture and design pattern of resource definition. In JMX , by defining a Java object MBean or MXBean Must end with MBean or MXBean .
The following figure shows the resource definition classes ending with MXBean in Java 17. By naming you can see what resources each class represents.
This article mainly introduces the monitoring and management functions in Java SE, so that everyone has a specific understanding of the principles and concepts behind monitoring and management in Java, so the specific design and implementation of MBeans and MXBeans are not the focus of this article , I don't need to introduce too much here, and I will put it in the next independent JMX technical article.
Java monitoring and management tools
JMX technology mentions that JMX not only provides APIs for monitoring and management, but also provides services for remote network management. You can use JMX-related monitoring and management tools to remotely connect to a running Java virtual machine through the network to monitor its running status. jconsole integrated in Java is such a tool.
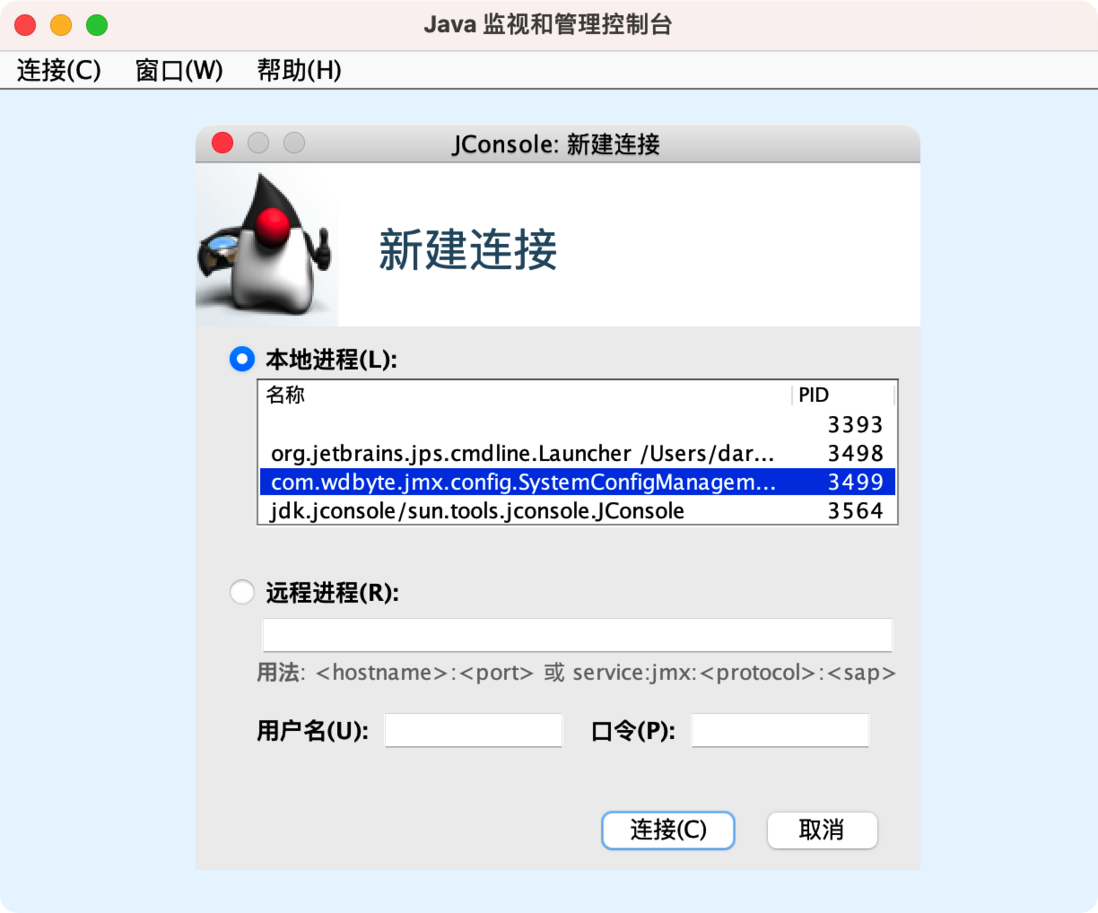
Start a Java program that can run continuously locally as the monitored object. If you have configured the Java environment variables, you can directly start the tool jconsole
$ jconsoleAfter starting, jconsole has already listed the local running Java programs, select the ones you want to monitor for monitoring.
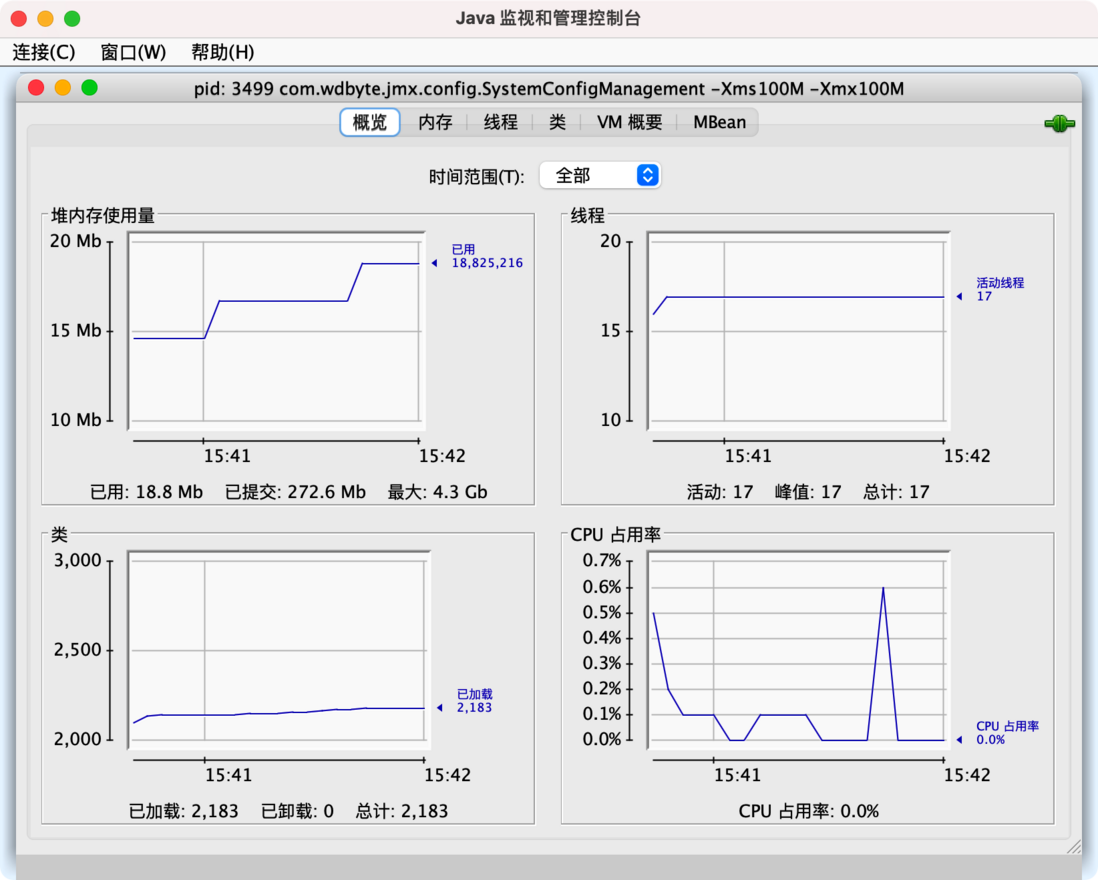
After the connection is successful, you can see the resource occupancy of the current Java process.
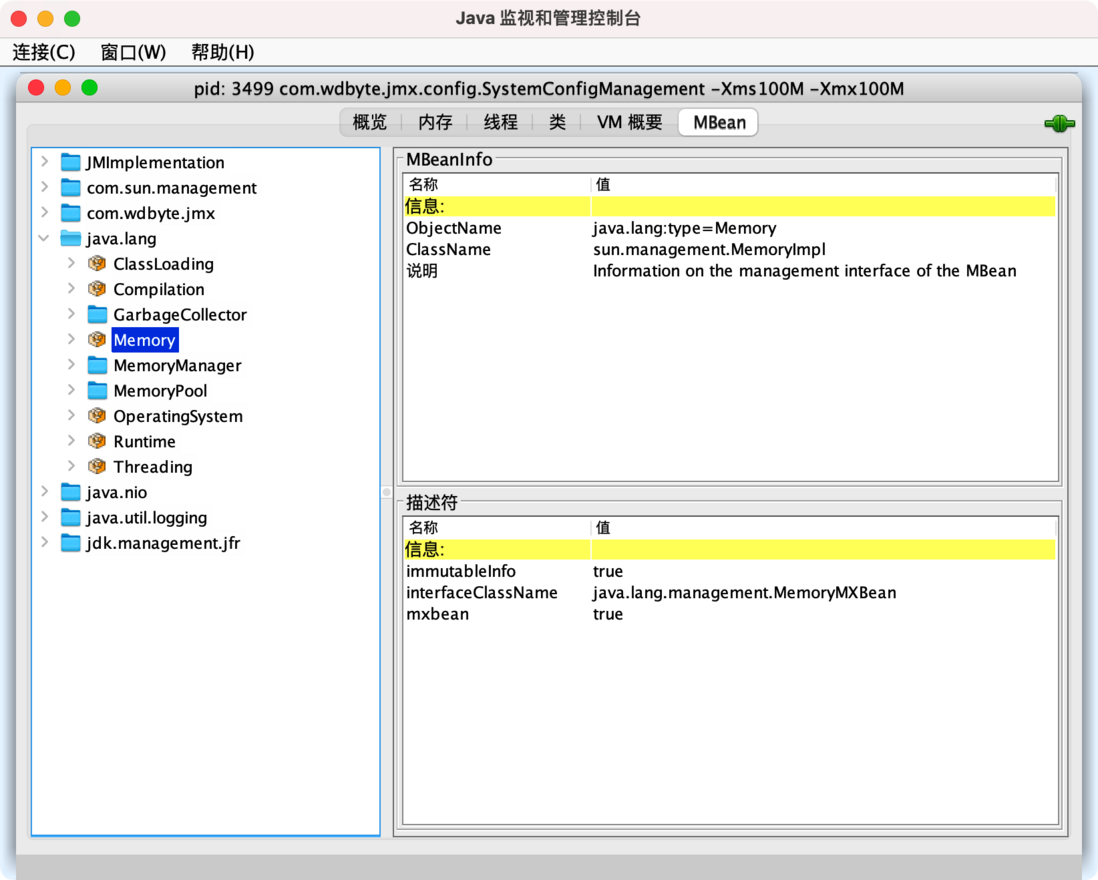
In the MBean page, you can see the specific conditions of various resources that have been defined.
Jconsole is a powerful graphical interface JMX management tool that can not only connect to local Java programs, but also monitor the running status of remote Java programs through the network, but it is not the focus of this article and will not be described in detail.
Reference:
The current article belongs to the Java performance analysis and optimization series of articles, click to view all articles.
The article is continuously updated. You can search for " Program or visit " Program Blog 161a9cbd9d305 First Time Reading This article Github.com/niumoo/JavaNotes has been included, there are many knowledge points and series of articles, welcome to Star.


**粗体** _斜体_ [链接](http://example.com) `代码` - 列表 > 引用。你还可以使用@来通知其他用户。