foreword
In this era of "reading maps for all", traditional map styles have been difficult to meet people's diverse needs. Tencent Location Services has been exploring ways to make maps "beautiful", striving to provide a better visual experience of maps.
In the information age, data is king. The abstract data is presented in an intuitive and vivid visualization, which can make it easier for people to discover the laws behind the data and improve the efficiency of business decision-making. If these data are also geo-located, the combination of visualization and map is more natural.
In recent years, Tencent's location service has continued to make efforts in data visualization. It has not only upgraded the data visualization effect on the Web side, but also released the data visualization layer on the APP side for the first time in the industry.
The recently launched visual layer editing platform provides developers with a very convenient tool. With the click of a mouse, a professional and beautiful layer style is ready to appear, which greatly reduces the difficulty for developers to configure visual layers and improves the efficiency of creating layers.
1. Powerful editing platform, easy to master configuration
1.1 Style configuration
The opening of parameters such as radiation radius, thermal height, honeycomb type, and honeycomb height allows a reasonable expression of variable data scale and distribution; the settings of parameters such as color, transparency, and growth animation allow developers to customize of sufficient space.
In addition, the editing platform also presets several sets of color matching templates, including general, warm color, cool color, strong contrast, etc. Developers do not need tedious configuration, and they can directly have a "high-value" visualization effect by selecting the corresponding template.
1.2 Display Control
The editing platform supports controlling the upper and lower cascading relationship between layers and POIs, the display interval of extreme values, etc. At the same time, it also supports setting which map levels the layers are displayed in. Developers can freely control under what conditions and in what way the layers are displayed according to business needs. Take control, do whatever you want!
1.3 Modify the basemap style
The layer editing platform has achieved a perfect combination with personalized styles. Before editing the data layer, developers can choose any set of personalized styles as the basemap to make your visualization more outstanding and unique. The platform has built-in 11 sets of personalized style templates, there is always one suitable for you!
1.4 Quick preview, what you see is what you get
All configuration modifications mentioned above can be seen in real time in the preview interface on the right side of the editing platform. If you download our SDK Demo, you can also preview the effect on the mobile terminal. Preview and adjust at any time, helping developers to easily adjust the visualization to the best.
2. Support small programs, common to all platforms
Previously, our visualization layer has covered the web and mobile terminals. Recently, we have also opened up the development interface , which is truly universal across the platform and has become a unique advantage of Tencent's location service! Editing once and sharing by multiple terminals will greatly save the configuration cost of developers.
For details, please refer to Visualization Layer User Guide to learn how to call each application.
3. Rich application scenarios
The application scenarios of visual data layers are very wide, and many customers have already accessed this function.
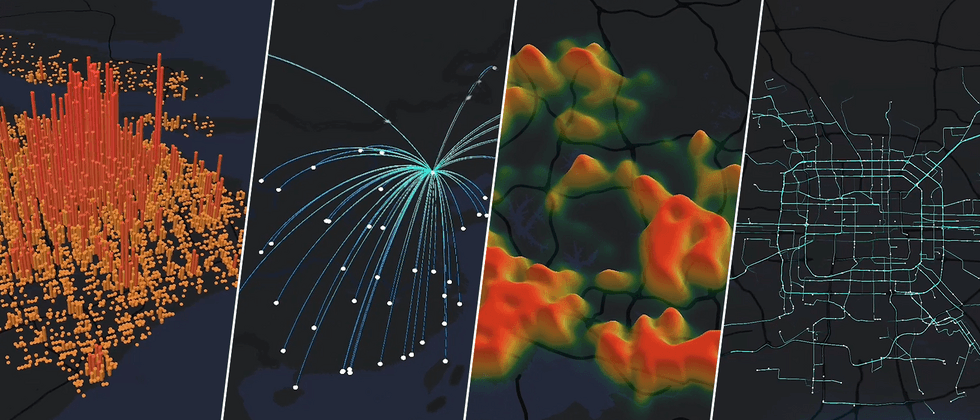
For example, the flight record module of Feichangzhun, based on the visualization effect of our arc graph, draws a route network map exclusive to each user, and weaves a home-centered network for users.
A visualization style like heat map is widely used in various background management systems, such as scenic spots, shopping malls, airport stations, etc., for managers to monitor the flow of people in real time and improve management efficiency.
There is also a cellular heat map, which is used by our travel industry customers on the driver-end APP to display the order distribution in the surrounding area of the driver, so that the driver can be "targeted" and increase the success rate of orders.
Summarize
I believe that seeing this, there are many developers who are ready to give it a try. We look forward to the deep integration of data visualization products with your business scenarios to help customers develop rapidly. Welcome to the official website of Tencent Location Services, enter the console - data layer, and immediately experience the data layer editing platform to make your data "live" and appear on the "map"!


**粗体** _斜体_ [链接](http://example.com) `代码` - 列表 > 引用。你还可以使用@来通知其他用户。