foreword
When developing Electron applications, in order to improve work efficiency, we need to use debugging tools to find and solve problems in time.
VSCode is the most popular code editor at the moment, most of my code is developed on it, and Electron applications are no exception. Today, I will share how to debug the main process code of Electron application on VSCode.
The steps described in this article are based on those who are already familiar with or know the VSCode debugging method, please eat as needed!
build environment
The project used in this article is electron-quick-start .
$ git clone https://github.com/electron/electron-quick-start
$ cd ./electron-quick-start
$ npm install
After the above steps, the basic Electron application development environment is built. View package.json :
{
  "name": "electron-quick-start",
  "version": "1.0.0",
  "description": "A minimal Electron application",
  "main": "main.js",
  "scripts": {
    "start": "electron ."
  },
  "repository": "https://github.com/electron/electron-quick-start",
  "keywords": [
    "Electron",
    "quick",
    "start",
    "tutorial",
    "demo"
  ],
  "author": "GitHub",
  "license": "CC0-1.0",
  "devDependencies": {
    "electron": "16.0.6"
  }
}
We can run npm run start in the terminal to view the running result:
It can be seen that the environment construction has been completed! Next, enter the development and debugging link.
debug configuration
Open it with VSCode and do the following:
lauch.json file with the following configuration:
{
    // 使用 IntelliSense 了解相关属性。
    // 悬停以查看现有属性的描述。
    // 欲了解更多信息,请访问: https://go.microsoft.com/fwlink/?linkid=830387
    "version": "0.2.0",
    "configurations": [
        {
            "type": "pwa-node",
            "request": "launch",
            "name": "Launch Program",
            "skipFiles": [
                "<node_internals>/**"
            ],
            "program": "${workspaceFolder}/main.js"
        }
    ]
}
We modify its configuration as follows:
{
    "version": "0.2.0",
    "configurations": [
        {
            "name": "Debug Main Process",
            "type": "node",
            "request": "launch",
            "cwd": "${workspaceFolder}",
            "runtimeExecutable": "${workspaceFolder}/node_modules/.bin/electron",
            "windows": {
                "runtimeExecutable": "${workspaceFolder}/node_modules/.bin/electron.cmd"
            },
            "args": [
                "./main.js",  // 主文件路径
            ]
        }
    ]
}
start debugging
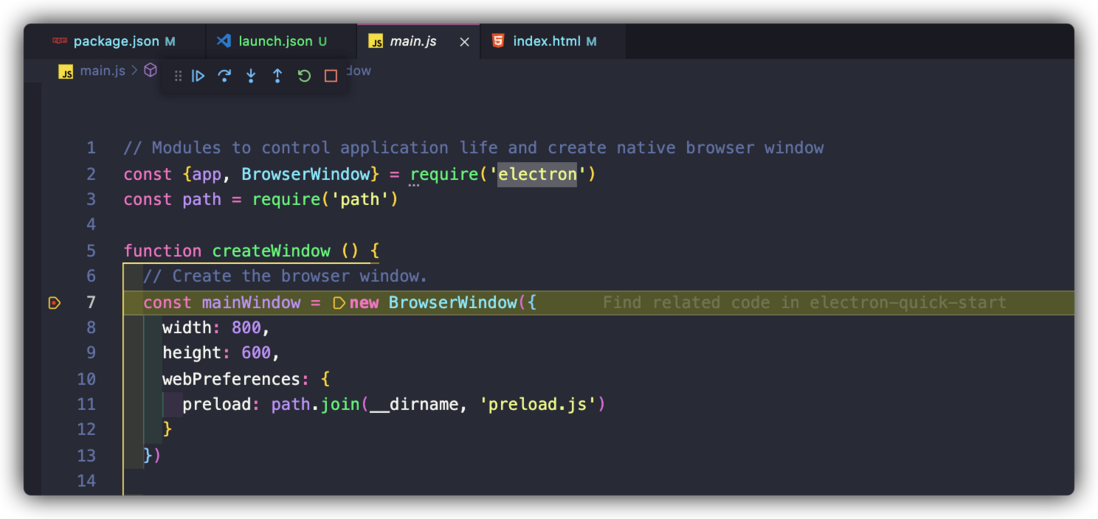
When we have completed the above environment setup and file configuration, we can debug happily (breakpoints as needed):
Everyone should be familiar with the debugging method of VSCode, so I won't go into details here. I hope you will have a good debugging and happy fishing!
concluding remarks
The method described in this article is only one of the methods to debug the code of the Electron main process.
~
~End of this article, thanks for reading!
~
Learn interesting knowledge, meet interesting friends, and shape interesting souls!
Hello everyone, I am the author Programming Samadhi Hermit King , my public is " 161e8c23430e2d Programming Samadhi ", welcome to pay attention, I hope you can give me more advice!
You come, with expectations, I have the fragrance of ink to welcome you! You return, no matter what you gain or lose, you can only give it away with the aftertaste!
Both knowledge and skills are emphasized, internal and external skills are cultivated, both theory and practice must be grasped, and both hands must be hard!


**粗体** _斜体_ [链接](http://example.com) `代码` - 列表 > 引用。你还可以使用@来通知其他用户。