Beats 是轻量级(资源高效,无依赖性,小型)和开放源代码日志发送程序的集合,这些日志发送程序充当安装在基础结构中不同服务器上的代理,用于收集日志或指标(Metrics)。这些可以是日志文件(Filebeat),网络数据(Packetbeat),服务器指标(Metricbeat)或 Elastic 和社区开发的越来越多的 Beats 可以收集的任何其他类型的数据。收集后,数据将直接发送到 Elasticsearch 或 Logstash 中进行其他处理。Beats建立在名为 libbeat 的 Go 框架之上,该框架用于数据转发,这意味着社区一直在开发和贡献新的 Beats。
Environment preparation
As a supplement to the Elastic Stack, you need to have Elasticsearch and Kibana installed before using Beats. Elasticsearch is used to store, analyze and retrieve data, while Kibana is used for visualization, monitoring and management. Next, it will be based on the Elastic Stack version 7.13.4, taking the Metricbeat component as an example, and the usage of other Beats components is similar. When installing Beats, one thing to note is that the version of Beats should be the same as the version of Elasticsearch and Kibana, or at least the major version.
Download and installation of Beats components
tar package installation
Here we take linux as an example: others are similar:
Create file directory
mkdir -p /usr/local/beats- Download the decompressed package:
curl -L -O https://artifacts.elastic.co/downloads/beats/metricbeat/metricbeat-7.13.4-linux-x8 6_64.tar.gz tar xzvf metricbeat-7.13.4-linux-x86_64.tar.gzIf our network is relatively slow, we can use domestic mirror downloads:
- decompress
tar xzvf metricbeat-7.13.4-linux-x86_64.tar.gzbase configuration
Enter the decompressed Metricbeat directory and you can see that the following files and folders are in the root directory of the installation directory:
$ ls -l
fields.yml
kibana
LICENSE.txt
metricbeat# 完整的配置文件模板
metricbeat.reference.yml# 默认的配置文件
metricbeat.yml
Module
modules.d
NOTICE.txt
README.md
We only modify and use the metricbeat.yml configuration file.
If your Elasticsearch and Kibana are both installed on the same host and configured with default ports,
You can skip this step without modifying the configuration. Metricbeat specifies localhost by default.
output.elasticsearch:
  hosts: ["localhost:9200"]
  # 如果 ElasticSearch 启用了认证需要配置账号密码
  username: "YOUR_ACCOUNT"
  password: "YOUR_PASSWORD"setup.kibana:
  host: "localhost:5601"
  # 如果 kibana 启用了认证需要配置账号密码
  username: "YOUR_ACCOUNT"
password: "YOUR_PASSWORD" Configure Metricbeat and specify the modules to run.
# 查看所有支持的模块
./metricbeat modules list # 打开 system 模块
./metricbeat modules enable system
Set up the initialization environment, before making sure Elasticsearch and Kibana are up and running:
./metricbeat setup -eThe output of the above command is:
./metricbeat setup
Overwriting ILM policy is disabled. Set `setup.ilm.overwrite: true` for enabling.

Index setup finished.
Loading dashboards (Kibana must be running and reachable)
As shown above.
During the setup process, it will generate the corresponding Dashboard, Index patterns, Index template, index lifecycle management strategy and corresponding Ingest pipeline for Beat. This command takes a long time to run. Need to be patient. The above command only needs to be run once for a Beat.
Docker install
We installed under centos/7 of virtual machine linux on machine: 192.168.2.14.
pull image
docker pull docker.elastic.co/beats/metricbeat:7.13.4Start Docker version of Metricbeat
download mirror
We can also start the docker container first, and then set the address of es or kibana again:
docker run -d --name=metricbeat docker.elastic.co/beats/metricbeat:7.13.4the metricbeat.docker.yml template file
curl -L -O https://raw.githubusercontent.com/elastic/beats/7.13/deploy/docker/metricbeat.docker.ymlIf the following problems occur:
[vagrant@loaclhost /]$ curl -L -O https://raw.githubusercontent.com/elastic/beats/7.13/deploy/docker/metricbeat.docker.yml

  % Total    % Received % Xferd  Average Speed   Time    Time     Time  Current
                                 Dload  Upload   Total   Spent    Left  Speed
  0     0    0     0    0     0      0      0 --:--:-- --:--:-- --:--:--     0curl: (7) Failed connect to raw.githubusercontent.com:443; Connection refused
Indicates that we cannot access the above githubusercontent network, reference: https://github.com/hawtim/blog/issues/10
Enter: raw.githubusercontent.com in the ip address query place and get the following results:
At this point we need to add the addresses involved in the corresponding raw.githubusercontent.com to the hosts file under linux:
185.199.108.133 raw.githubusercontent.com
185.199.108.133 user-images.githubusercontent.com
185.199.108.133 avatars2.githubusercontent.com
185.199.108.133avatars1.githubusercontent.com
Add es and kibana information:
output.elasticsearch:
  hosts: '192.168.2.11:9200'
  username: 'elastic'
  password: 'elastic'
setup.kibana:
  host: 192.168.2.14:5601
start the metricbeat container
docker run -d \
  --name=metricbeat \
  --user=root \
  --volume="$(pwd)/metricbeat.docker.yml:/usr/share/metricbeat/metricbeat.yml:ro" \
  --volume="/var/run/docker.sock:/var/run/docker.sock:ro" \
  --volume="/sys/fs/cgroup:/hostfs/sys/fs/cgroup:ro" \
  --volume="/proc:/hostfs/proc:ro" \
  --volume="/:/hostfs:ro" \
  docker.elastic.co/beats/metricbeat:7.13.4
Metricbeat configuration integrates kibana, elasticsearch
goes into container
docker exec -it metricbeat bashstart system and container monitoring modules:
metricbeat modules enable system
metricbeat modules enable docker
Start Beats
After Metricbeat is started, it will send system metrics data to Elasticsearch.
./metricbeat -eDo you find it difficult to memorize the installation steps above? In Kibana, Elastic has described how to add data in detail, and the installed version must be the same as the version of Elasticsearch and Kibana you installed.
The specific operation steps are as follows:
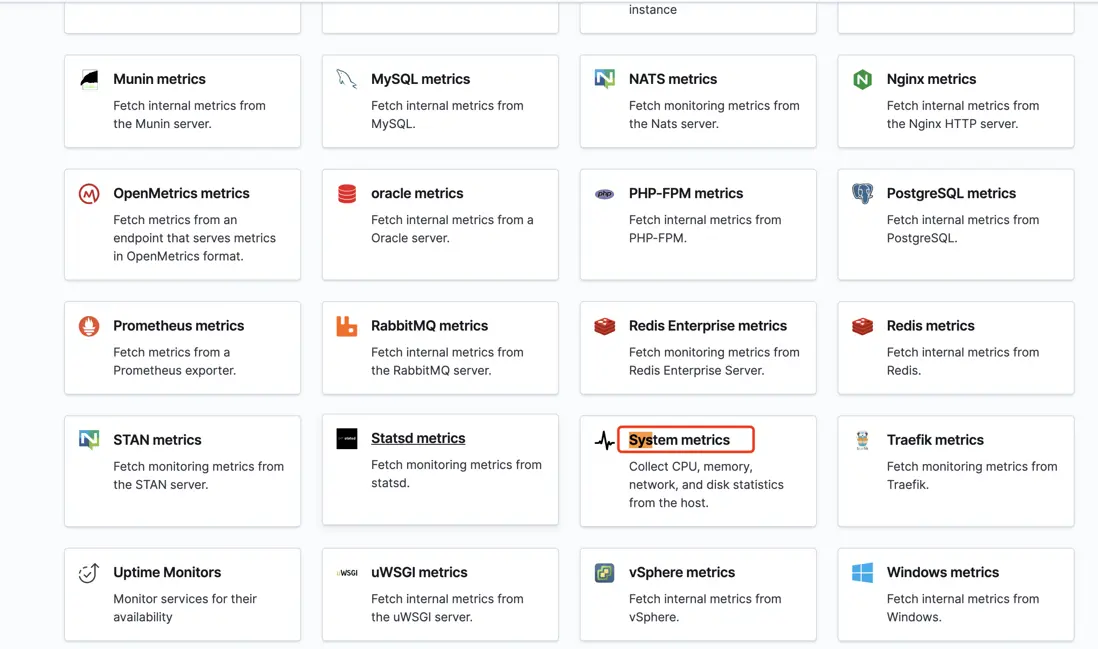
Add data
Metrics
The specific steps to install various metrics are shown above. Taking System metrics as an example, scroll down the page above:
Above, we select the desired operating system. Then follow the installation steps above step by step.
We can complete the required installation of Beat.
Check the collected data
We first open Kibana and start Dashboard:
Above, we search for the metricbeat system, and we can find the Dashboard that has been preset. We choose [Metricbeat System] Overview ECS:
common problem
Dashboard on metricbeat of kibana does not display system monitoring information
Access: http://192.168.2.14:5601/api/fleet/settings appears:
{"statusCode":403,"error":"Forbidden","message":"Access to Fleet API require the superuser role, and for stack security features to be enabled."}solution:
Reference: https://www.elastic.co/guide/en/kibana/current/using-kibana-with-security.html
A password for secure access to kibana needs to be configured.
ES set password:
https://blog.csdn.net/qq_31239495/article/details/111207794
Exiting: data path already locked by another beat. Please make sure that multiple beats are not sharing the same data path (path.data).
The above problem occurs after entering the metricbeat container run by docker.
Reboot required
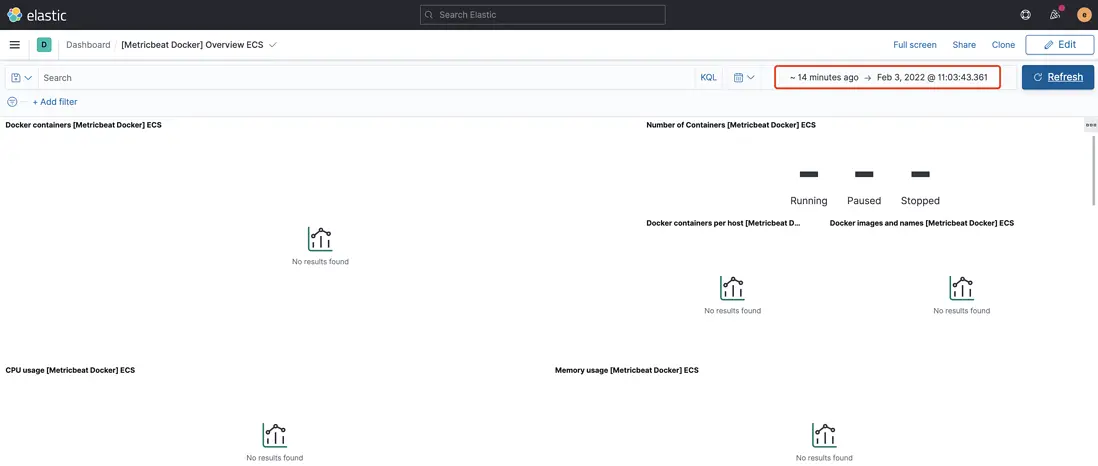
The system data of the metricbeat part cannot be seen in the dashboard of kibana
The reason is that when we query the monitoring, we choose 14 minutes, and the clock is inconsistent, which prevents us from querying the latest display information.
refer to
https://blog.csdn.net/u011337602/article/details/104541261/
https://blog.csdn.net/weixin_41806245/article/details/102950969
Failed to connect to raw.githubusercontent.com port 443: Connection refused problem
https://github.com/hawtim/blog/issues/10
Official website:
https://www.elastic.co/guide/en/beats/metricbeat/7.13/running-on-docker.html


**粗体** _斜体_ [链接](http://example.com) `代码` - 列表 > 引用。你还可以使用@来通知其他用户。