Recently I visited the official website of Redis and found that Redis not only launched many new features, but also released a visualization toolRedisInsight. It feels very good to try it out. The most important thing is to support new features such as RedisJSON, which is unmatched by third-party tools. Today, I will take you to experienceRedisInsight, which is really easy to use!
SpringBoot actual e-commerce project mall (50k+star) address: https://github.com/macrozheng/mall
Introduction to RedisInsight
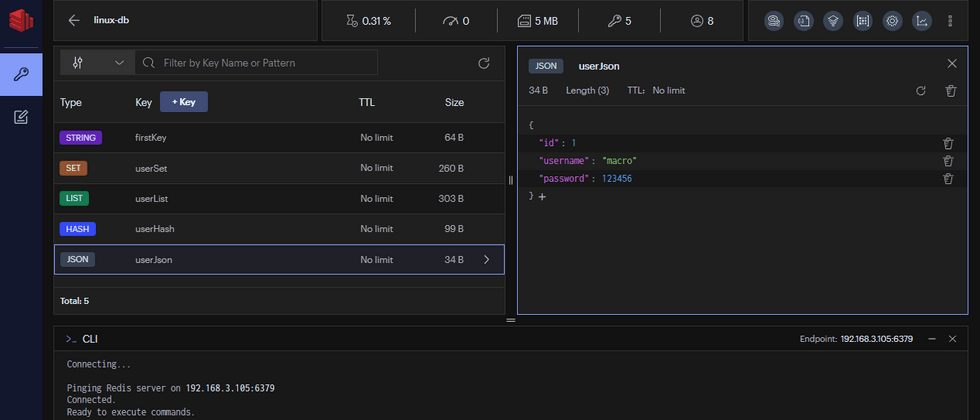
RedisInsight is a visual management tool officially produced by Redis, which can be used to design, develop and optimize your Redis applications. Support both dark and light themes, the interface is very cool! It can support the management of various data types such as String, Hash, Set, List, JSON, etc. At the same time, it supports the remote use of CLI functions, which is very powerful!
The following is a rendering of the use of RedisInsight, the appearance is good!
Introduction to RedisMod
After years of development, Redis has become more than just an in-memory database. With the support of RedisMod, the function of Redis will become very powerful. RedisMod includes the following enhancement modules:
- RediSearch: a full-featured search engine;
- RedisJSON: native support for JSON type;
- RedisTimeSeries: time series database support;
- RedisGraph: graph database support;
- RedisBloom: native support for probabilistic data;
- RedisGears: programmable data processing;
- RedisAI: Real-time model management and deployment for machine learning.
Install
First, we will use Docker to install Redis, pay attention to download the full version of Redis, RedisMod, which is an enhanced version of Redis with all the modules built in!
- Use the following command to download the image of RedisMod;
docker pull redislabs/redismod:preview- Run the RedisMod service in a container.
docker run -p 6379:6379 --name redismod \
-v /mydata/redismod/data:/data \
-d redislabs/redismod:preview
use
After the Redis service is installed, let's use RedisInsight to manage it and try it!
basic use
- First download the installation package of RedisInsight, download address: https://redis.com/redis-enterprise/redis-insight/
- After the download is complete, you can install it directly. After the installation is complete, select
on the main interface to add the Redis database;
- Select
manually add the database, and enter the Redis service connection information;
- After opening the connection, you can manage Redis, and the installed Redis enhancement module will be displayed in the upper right corner;
- Next, we can add key-value pair data in Redis through RedisInsight, such as adding
Stringtype key-value pair;
- Adding Hash type, you can edit a single attribute when editing, which is quite convenient;
- Add a List type, and you can directly push elements into it when editing;
- Add JSON type, which can be supported after installing the RedisJSON module;
- For native JSON types, it not only supports highlight preview, but also supports adding, editing and deleting individual properties, which is convenient!
- In addition, RedisInsight also supports dark and light theme switching, which can be changed in the settings.
CLI
- If the graphical interface function of RedisInsight is not enough for you, you can also try its
CLIfunction, and click the CLI tab in the lower left corner to open it;
- The intimate Redis official is afraid that you cannot remember the command, and also added the function of
Command Helperto find the command document. For example, we can search for the usage of the commandhget.
Profiler
Through the Profiler function, we can view the command execution log of Redis. For example, we use RedisInsight to add a key-value pair called testKey , and the Profiler will display the following log.
Visual monitoring
The Redis monitoring function of RedisInsight is relatively simple. Personally, I prefer to use Grafana to monitor Redis. For the specific use of Grafana, please refer to Grafana usage tutorial .
Install Grafana
- First download the Docker image of Grafana;
docker pull grafana/grafana- Run Grafana after the download is complete;
docker run -p 3000:3000 --name grafana \
-d grafana/grafana- Next, download the Docker image of Prometheus;
docker pull prom/prometheus- Create the Prometheus configuration file
prometheus.ymlin the/mydata/prometheus/directory:
global:
scrape_interval: 5s- Run Prometheus and mount the configuration file
prometheus.ymlin the host into the container;
docker run -p 9090:9090 --name prometheus \
-v /mydata/prometheus/prometheus.yml:/etc/prometheus/prometheus.yml \
-d prom/prometheus- Enter the grafana container and install
redis-datasourceplugin. After the installation is complete, you need to restart the grafana service.
docker exec -it grafana /bin/bash
grafana-cli plugins install redis-datasource
use
- To connect to redismod, you need to use its container IP address. Use the following command to view the IP address of the redismod container;
- Configure the Redis data source in Grafana, log in with the
admin:adminaccount, and access the address; http://192.168.3.105:3000/
- Configure Redis address information, pay attention to the container IP address of redismod;
- Open Dashboard and select Redis;
- Next, you can see a very complete Redis monitoring dashboard, which can basically meet the monitoring needs of Redis.
Summarize
RedisInsight is worthy of being an official visualization tool, and it feels like the best Redis tool to use at present! Especially the support for the new features of Redis, other tools are unmatched! However, the monitoring function of Redis is indeed a bit simple. You still have to use the professional monitoring tool Grafana to monitor Redis!
If you want to learn more Redis combat skills, you can try this practical project with a full set of tutorials (50K+Star): https://github.com/macrozheng/mall
References
I feel that the official documentation of Redis is very conscientious, and I strongly recommend that you read it!
Official documentation: https://developer.redis.com/explore/redisinsightv2


**粗体** _斜体_ [链接](http://example.com) `代码` - 列表 > 引用。你还可以使用@来通知其他用户。