k8s tutorial description
- The essence of k8s underlying principle and source code explanation
- Advanced chapter of k8s underlying principle and source code explanation
- K8s pure source code interpretation course, help you become a k8s expert
- k8s-operator and crd combat development help you become a k8s expert
- Interpretation of source code of tekton full pipeline actual combat and pipeline operation principle
Prometheus full component tutorial
- 01_prometheus configuration and use of all components, analysis of underlying principles, and high availability
- 02_prometheus-thanos use and source code interpretation
- 03_kube-prometheus and prometheus-operator actual combat and principle introduction
- 04_prometheus source code explanation and secondary development
go language courses
- golang basic course
- Golang operation and maintenance platform actual combat, service tree, log monitoring, task execution, distributed detection
alert ql
histogram_quantile(0.99, sum(rate(scheduler_e2e_scheduling_duration_seconds_bucket{job="kube-scheduler"}[5m])) without(instance, pod)) > 3 for 1mMeaning: scheduling takes more than 3 seconds
Track the metrics of this histogram
- Code version v1.20
- LocationD:\go_path\src\github.com\kubernetes\kubernetes\pkg\scheduler\metrics\metrics.go
- Trace the caller, in the observeScheduleAttemptAndLatency wrapper, at D:\go_path\src\github.com\kubernetes\kubernetes\pkg\scheduler\metrics\profile_metrics.go
- Here you can see that the three results of scheduling will record the relevant time-consuming
trace caller
- Location D:\go_path\src\github.com\kubernetes\kubernetes\pkg\scheduler\scheduler.go + 608
- In the function Scheduler.scheduleOne, it is used to record the time-consuming of scheduling each pod
- You can see the specific call point at the bottom of the asynchronous bind function
From this, it is concluded that e2e is the time-consuming calculation of the entire scheduleOne
 go func() {
      err := sched.bind(bindingCycleCtx, fwk, assumedPod, scheduleResult.SuggestedHost, state)
      if err != nil {
          metrics.PodScheduleError(fwk.ProfileName(), metrics.SinceInSeconds(start))
          // trigger un-reserve plugins to clean up state associated with the reserved Pod
          fwk.RunReservePluginsUnreserve(bindingCycleCtx, state, assumedPod, scheduleResult.SuggestedHost)
          if err := sched.SchedulerCache.ForgetPod(assumedPod); err != nil {
              klog.Errorf("scheduler cache ForgetPod failed: %v", err)
          }
          sched.recordSchedulingFailure(fwk, assumedPodInfo, fmt.Errorf("binding rejected: %w", err), SchedulerError, "")
      } else {
          // Calculating nodeResourceString can be heavy. Avoid it if klog verbosity is below 2.
          if klog.V(2).Enabled() {
              klog.InfoS("Successfully bound pod to node", "pod", klog.KObj(pod), "node", scheduleResult.SuggestedHost, "evaluatedNodes", scheduleResult.EvaluatedNodes, "feasibleNodes", scheduleResult.FeasibleNodes)
          }
          metrics.PodScheduled(fwk.ProfileName(), metrics.SinceInSeconds(start))
          metrics.PodSchedulingAttempts.Observe(float64(podInfo.Attempts))
          metrics.PodSchedulingDuration.WithLabelValues(getAttemptsLabel(podInfo)).Observe(metrics.SinceInSeconds(podInfo.InitialAttemptTimestamp))

          // Run "postbind" plugins.
          fwk.RunPostBindPlugins(bindingCycleCtx, state, assumedPod, scheduleResult.SuggestedHost)
      }
}
Which processes are included in scheduleOne from top to bottom
01 Time-consuming scheduling algorithm
example code
 // 调用调度算法给出结果
scheduleResult, err := sched.Algorithm.Schedule(schedulingCycleCtx, fwk, state, pod)
// 处理错误
if err != nil{}
// 记录调度算法耗时
metrics.SchedulingAlgorithmLatency.Observe(metrics.SinceInSeconds(start
}))
From the above, it can be seen that there are mainly 3 steps
- Call the scheduling algorithm to give the result
- handle errors
- Record scheduling algorithm time-consuming
Then we should first calculate the time-consuming of the algorithm, and the corresponding histogram metrics are
histogram_quantile(0.99, sum(rate(scheduler_scheduling_algorithm_duration_seconds_bucket{job="kube-scheduler"}[5m])) by (le))- Combining the e2e and algorithm 99th quantile time consumption with the curve of the alarm time shows a high degree of fit
- However, it was found that the algorithm > e2e under the 99th percentile, but according to e2e as the bottom line, it should be that e2e is higher, so adjusting the 999th percentile found that the two are almost the same
- The reason for the above problem is related to the error of the prometheus histogram linear interpolation method. For details, please refer to my article on the principle of histogram linear interpolation method.
Algorithm.Schedule specific process
Two main function calls can be seen in Schedule
 feasibleNodes, filteredNodesStatuses, err := g.findNodesThatFitPod(ctx, fwk, state, pod)
priorityList, err := g.prioritizeNodes(ctx, fwk, state, pod, feasibleNodes)
Among them, findNodesThatFitPod corresponds to the filter process, and the corresponding metrics are scheduler_framework_extension_point_duration_seconds_bucket
histogram_quantile(0.999, sum by(extension_point,le) (rate(scheduler_framework_extension_point_duration_seconds_bucket{job="kube-scheduler"}[5m])))- Related screenshots can be seen
prioritizeNodes corresponds to the score process, and the corresponding metrics are
histogram_quantile(0.99, sum by(plugin,le) (rate(scheduler_plugin_execution_duration_seconds_bucket{job="kube-scheduler"}[5m])))- Related screenshots can be seen
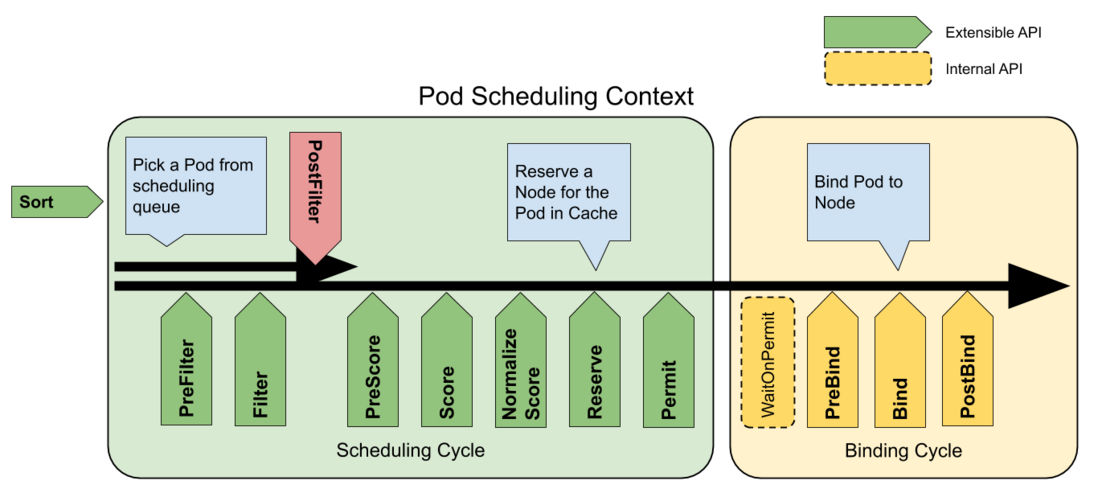
- The above specific algorithm flow can match the flow chart given in the official document
02 Time-consuming scheduling algorithm
- Let's go back and look at the process of bind
The core of which is bind here
err := sched.bind(bindingCycleCtx, fwk, assumedPod, scheduleResult.SuggestedHost, state)You can see that it is timed separately inside the bind function
 func (sched *Scheduler) bind(ctx context.Context, fwk framework.Framework, assumed *v1.Pod, targetNode string, state *framework.CycleState) (err error) {
  start := time.Now()
  defer func() {
      sched.finishBinding(fwk, assumed, targetNode, start, err)
  }()

  bound, err := sched.extendersBinding(assumed, targetNode)
  if bound {
      return err
  }
  bindStatus := fwk.RunBindPlugins(ctx, state, assumed, targetNode)
  if bindStatus.IsSuccess() {
      return nil
  }
  if bindStatus.Code() == framework.Error {
      return bindStatus.AsError()
  }
  return fmt.Errorf("bind status: %s, %v", bindStatus.Code().String(), bindStatus.Message())
}
The corresponding metric is
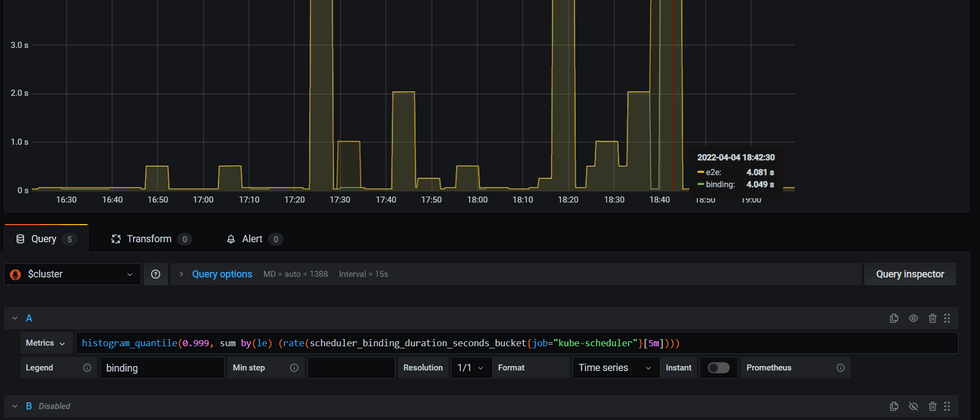
histogram_quantile(0.999, sum by(le) (rate(scheduler_binding_duration_seconds_bucket{job="kube-scheduler"}[5m])))- Here we compare the 999th quantile value of e2e and bind
- It is found that bind and e2e are more consistent than alg
- At the same time, it is found that the two main processes inside bind, sched.extendersBinding, execute external binding plugins
- fwk.RunBindPlugins executes internal binding plugins
Internally bound plugin
The code is as follows, the main process is to execute the binding plugin
 // RunBindPlugins runs the set of configured bind plugins until one returns a non `Skip` status.
func (f *frameworkImpl) RunBindPlugins(ctx context.Context, state *framework.CycleState, pod *v1.Pod, nodeName string) (status *framework.Status) {
  startTime := time.Now()
  defer func() {
      metrics.FrameworkExtensionPointDuration.WithLabelValues(bind, status.Code().String(), f.profileName).Observe(metrics.SinceInSeconds(startTime))
  }()
  if len(f.bindPlugins) == 0 {
      return framework.NewStatus(framework.Skip, "")
  }
  for _, bp := range f.bindPlugins {
      status = f.runBindPlugin(ctx, bp, state, pod, nodeName)
      if status != nil && status.Code() == framework.Skip {
          continue
      }
      if !status.IsSuccess() {
          err := status.AsError()
          klog.ErrorS(err, "Failed running Bind plugin", "plugin", bp.Name(), "pod", klog.KObj(pod))
          return framework.AsStatus(fmt.Errorf("running Bind plugin %q: %w", bp.Name(), err))
      }
      return status
  }
  return status
}
Then the default binding plugin is bound to the specified node by calling the bind method of the pod, and the binding is the sub-resource of the pods
 // Bind binds pods to nodes using the k8s client.
func (b DefaultBinder) Bind(ctx context.Context, state *framework.CycleState, p *v1.Pod, nodeName string) *framework.Status {
  klog.V(3).Infof("Attempting to bind %v/%v to %v", p.Namespace, p.Name, nodeName)
  binding := &v1.Binding{
      ObjectMeta: metav1.ObjectMeta{Namespace: p.Namespace, Name: p.Name, UID: p.UID},
      Target:     v1.ObjectReference{Kind: "Node", Name: nodeName},
  }
  err := b.handle.ClientSet().CoreV1().Pods(binding.Namespace).Bind(ctx, binding, metav1.CreateOptions{})
  if err != nil {
      return framework.AsStatus(err)
  }
  return nil
}
Executing the binding action also has related metrics statistics time-consuming,
histogram_quantile(0.999, sum by(le) (rate(scheduler_plugin_execution_duration_seconds_bucket{extension_point="Bind",plugin="DefaultBinder",job="kube-scheduler"}[5m])))At the same time, there is also a defer func in RunBindPlugins that is responsible for counting time-consuming
histogram_quantile(0.9999, sum by(le) (rate(scheduler_framework_extension_point_duration_seconds_bucket{extension_point="Bind",job="kube-scheduler"}[5m])))- From the above two metrics, the internal plug-in time-consuming is very low
extendersBinding external plugin
The code is as follows, traverse the Extenders of Algorithm, judge that it is of the bind type, and then execute extender.Bind
 // TODO(#87159): Move this to a Plugin.
func (sched *Scheduler) extendersBinding(pod *v1.Pod, node string) (bool, error) {
  for _, extender := range sched.Algorithm.Extenders() {
      if !extender.IsBinder() || !extender.IsInterested(pod) {
          continue
      }
      return true, extender.Bind(&v1.Binding{
          ObjectMeta: metav1.ObjectMeta{Namespace: pod.Namespace, Name: pod.Name, UID: pod.UID},
          Target:     v1.ObjectReference{Kind: "Node", Name: node},
      })
  }
  return false, nil
}
The extender.Bind corresponds to the dispatcher sent to the external through http
// Bind delegates the action of binding a pod to a node to the extender. func (h *HTTPExtender) Bind(binding *v1.Binding) error { var result extenderv1.ExtenderBindingResult if !h.IsBinder() { // This shouldn't happen as this extender wouldn't have become a Binder. return fmt.Errorf("unexpected empty bindVerb in extender") } req := &extenderv1.ExtenderBindingArgs{ PodName: binding.Name, PodNamespace: binding.Namespace, PodUID: binding.UID, Node: binding.Target.Name, } if err := h.send(h.bindVerb, req, &result); err != nil { return err } if result.Error != "" { return fmt.Errorf(result.Error) } return nil }- It is a pity that there is no related metrics statistics time-consuming
- Currently guessing the time-consuming execution of traversing sched.Algorithm.Extenders
- Here sched.Algorithm.Extenders comes from the configuration in KubeSchedulerConfiguration
- That is, write a configuration file and pass its path to the command line parameters of kube-scheduler to customize the behavior of kube-scheduler. I have not seen it yet.
Summarize
scheduler scheduling process
The scheduling of a single pod is mainly divided into three steps:
- According to the two stages of Predict and Priority, call the respective algorithm plug-ins to select the optimal Node
- The Assume Pod is scheduled to the corresponding Node and saved to the cache
- Verify with extenders and plugins, and bind if passed
e2e time consumption mainly comes from bind
- But at present, it does not take a long time to see that bind is executed.
- to be continued


**粗体** _斜体_ [链接](http://example.com) `代码` - 列表 > 引用。你还可以使用@来通知其他用户。