
foreword
With the development of the economy and the improvement of people's living standards, people have higher and higher requirements for improving the level of medical services, and managers of medical institutions also hope to improve management efficiency through information technology. Hospitals are gradually transforming in the direction of intelligence. With the help of emerging technologies, smart hospitals, Internet + medical care, mobile medical care, telemedicine, big data and smart wearable devices have begun to emerge in the medical industry. Highly fragmented device environments, evolving platform architectures, and massive data analysis will all transform into digital healthcare through technology.
Tupu software applies the self-developed HT products, seamlessly integrates 2D and 3D technologies, and builds a set of lightweight 3D visualized smart hospital management and control systems. It is composed of three modules into a large long screen, which is displayed around modules such as medical billboards, department monitoring, and hospital parks. Make the original independent systems of the hospital form a linkage plan and management integration according to their own characteristics.
Show results
This case has changed from the previous one-screen display form, and is presented by combining three large-screen modules into a large long screen. The middle is the main large screen, and the two sides are sub-screens. Each large-screen module is independent and integrated. HT comes with interactive left and right switching scenes to realize rotation, translation, zooming in and zooming out of the three module scenes, as well as 360-degree omnidirectional browsing without dead ends.
HT visualization supports editor custom styles, layouts, and menu toolbars. 2D and 3D scenes can be nested, superimposed, rotated and scaled on the editor, highly componentized and seamlessly integrated, carrying more than 100,000 2D, 3D and UI table tree general component primitives, to meet the massive Internet of Things Device and data scenario requirements.

Hospital campus exterior
After the interface is initialized, the main scene of the case gradually transitions from a wireframe building to a realistic scene. The overall design is based on a realistic style. Through 3D modeling of the buildings and roads in the hospital, combined with rich 2D and 3D configurations, the simulation restores The overall effect and data display of the digital hospital. Using the engine rendering independently developed by Hightopo software, the scene can be loaded and run efficiently and smoothly in the web and ensure the excellent visualization of the scene.
Park roaming scene
The initial screen roams the scene and supports 360-degree viewing of the park without dead ends. Through the built-in interaction of HT, the mouse can be rotated, panned, zoomed in and zoomed out. At the same time, it also supports cross-platform browsing, which can be easily opened by any mobile terminal, which is an advantage that the C-side platform does not have, and realizes the one-finger rotation, two-finger zooming, and three-finger panning operations of touch screen devices. worry about the different interaction modes.

Park information visualization
Combine HT visualization with the park management system, access the park management data to the visualization platform, and update the area, number of buildings, number of standard beds, and number of departments in the park in real time, as well as the hospital staff's attendance at the community health service center. The community medical service system can provide basic treatment for general diseases, community care for chronic diseases, upward referral for serious diseases, and services for receiving recovery referrals.
Click on the department information to view the clinic situation on each floor, which is convenient for the patient to choose the floor department.

Click on a hospital building to display the temperature and humidity of the building, as well as the wind speed, PM value, and dust in the area, which can help relevant maintenance personnel to monitor and reasonably adjust the temperature and humidity in the hospital, meet the needs of the hospital personnel, and keep the public area always In a more comfortable environment, the environment of the ward is in a monitorable state.

Nucleic acid detection visualization
With the development trend of the regularization of the new crown epidemic, real-time monitoring and timely epidemic prevention have become particularly important. Through the combination of nucleic acid detection management system and HT, the full-process paperless intelligent collection, rapid detection, cloud management, electronic reporting, visual display and many other functions can be presented. Effectively assist the epidemic prevention and control work, so that nucleic acid testing can fully realize information management. The number of appointments for nucleic acid testing, the number of people tested, and the nucleic acid results are displayed through the HT visualization 2D panel.
Energy management
Due to the particularity of its work, the hospital has put forward special and strict requirements for the power supply, distribution and safety of the hospital. The overload operation of various electrical equipment may lead to serious consequences such as power outage, operation interruption and equipment failure, which will bring serious consequences to the hospital and patients. It can monitor the power consumption of the hospital in real time, and realize the 2D configuration effect that can be viewed anytime, anywhere, even on the mobile phone. By collecting relevant electricity limit standards, comprehensive data are summarized, and real-time early warning is provided for equipment that exceeds the electricity limit.


Elevator operation monitoring
Real-time operation monitoring of elevators is performed through the 2D panel, and data updates of hospital elevators, freight elevators, and passenger elevators can be viewed by clicking on different buildings. In order to facilitate the use of the elevator by the personnel in the hospital, and the early warning monitoring and timely equipment safety inspection of the elevator by the operation and maintenance personnel.

Parking Space/Vehicle Information
Due to the particularity of the hospital, there is a lot of traffic in and out. Effective control and grooming through HT visualization. Unified management of vehicles in different areas. Support the combination of Internet of Things, video surveillance, vehicle positioning and other related technologies to obtain the real-time location of vehicles entering and leaving the park, vehicle owner information, parking time, license plate information and other monitoring information, and summarize and reflect the parking space information in the park in real time, including those in the park. Data visualization of the number of motor vehicles, the usage of charging piles, and the proportion of energy vehicles.

Video Surveillance Module
As a public place, the hospital has complex personnel. Although there are park patrol security settings, it cannot achieve real-time coverage of the entire park and 24-hour uninterrupted patrols. By combining visualization, all-round real-time monitoring can be achieved throughout the day, and the flow of people at all times of the day can be monitored. Statistical summary, real-time information capture of suspicious persons in various areas in the park, and information extraction, comparison and monitoring management of suspicious persons combined with the urban security system, empowering managers to process, institutionalize, and manage the security work of the park The digital management ensures the safety of life and property of the people in the park.
In order to improve the security management and control effect of the park, HT supports seamless integration of various multimedia functions of HTML5, links various security subsystems, conducts dynamic security monitoring in the public, office, equipment room and other areas, and locates the video equipment in each area. and monitoring of operating status. Query the monitoring screen through information such as the number and name of the device, and know the PIN, FPS, running time and other information of the monitoring status.

Traditional video surveillance cannot perform effective and intuitive real-time monitoring of large scenes, and there is no situational awareness. In other cases the HT video fusion solution can fuse 2D images into a 3D model of the scene, providing operators with intuitive video images and simple view control. The HT video fusion technology uses WebGL technology to process video images in real time using GPU high-performance computing capabilities. Image processing does not occupy CPU resources, and the entire solution has a smooth screen.
The "Smart Park Management and Control System" is based on the IoT ecosystem control platform architecture, and uses a new generation of information and communication technology to sense, monitor, analyze, control, and integrate the resources of each key link in the park, so that the systems can be interconnected, shared, and intelligent. The multi-information collaborative linkage has been realized, providing a strong guarantee for the safety management of the park, the convenient life of users, and the management of medical information. It effectively reduces the operating cost of the park, improves work efficiency, and strengthens various types of smart medical innovation, service and management capabilities.
Hospital Floor Management
Based on multi-dimensional data such as space, time, and indicators, real-time dynamic refresh of data such as environmental information, staff, and department registration personnel on each floor in the hospital is carried out. Synchronize multiple information such as personnel distribution in each floor, operating room usage, water and electricity consumption, monitoring system, fire alarm, etc., to create multi-parameter real-time online monitoring. Comprehensively promote the in-depth integration, resource sharing, and linkage control of multiple businesses on each floor of the hospital, so as to achieve the purpose of macroscopic comprehensive supervision between floors.

HT 2D and 3D can seamlessly integrate and reuse material resources in three-dimensional space. Click the department on the right panel to switch to the corresponding department. The environmental information, department conditions, and specific information of different departments can be accessed through the panel. To display, let hospital operation and maintenance personnel manage more intelligently.

Escape routes
The escape route planning map of each floor scene can be imported into the HT platform according to the CAD drawing, and it can be highlighted and processed, and it can also provide scientific escape route guidance planning.

Radiology department monitoring
CT inspection operation demonstration
That is, Computed Tomography (CT), which uses precisely collimated X-ray beams, gamma rays, ultrasonic waves, etc., together with a highly sensitive detector, to scan a certain part of the human body one by one. It has the characteristics of fast scanning time and clear images, and can be used for the inspection of various diseases. The information data collected by scanning is stored and calculated by the computer system, the image display and storage system, the image processed and reconstructed by the computer is displayed on the TV screen or the image is captured by multiple cameras or laser cameras.

HT is a 2D and 3D graphics rendering engine based on HTML5, which has rich display forms and effects. In the case, we built a 3D animation demonstration during CT examination and the operation setting scene of the CT console. Through HT visualization, users can understand the inspection scene more intuitively and clearly, and HT can also be used to control the color, section and other information adjustment problems during CT inspection.

Support the integration of the management system data of the CT examination room in the hospital, comprehensively monitor key information such as indoor and outdoor environment, power consumption, equipment problems, patients and physicians, and provide a variety of visual analysis methods to assist managers in comprehensively grasping the examination room. All kinds of information provide decision-making basis for medical resource allocation and patient treatment plan adjustment.
Smart medicine
The establishment of a smart pharmacy module can provide full-process digital services for hospital pharmacy drug procurement, storage, warehouse, sorting, and delivery. After the patient pays the bill, the prescription information will be sent to the dispensing machine. The dispensing machine will select the medicines according to the required prescription information, and then send the medicines to the pharmacy window through the conveyor belt. The pharmacist only needs to check the medicine list. Can be distributed to patients. The smart pharmacy reduces the original processing time of several minutes to more than ten seconds, which greatly improves the tedious dispensing and dispensing efficiency of doctors, shortens the waiting time of patients, and avoids the risk of cross-infection during the drug collection process.

The intuitive and concise management form of HT data visualization pharmacy regulates a series of problems such as drug inventory, storage, and distribution to a large extent. Realize diversified functions such as tracking the flow of each box of drugs, registering the proportion of storage types, prompting of best-selling or unsalable drugs, and record management of "five specialties" of narcotic drugs and first-class psychotropic drugs. Smart inventory supports adding functions such as custom trend viewing, data analysis, and consumption curve comparison, and performs multi-directional parallel analysis on demand. Help hospital outpatient pharmacies to achieve a refined, intelligent, and streamlined management form.
Choose to be equipped with intelligent sensors to perform real-time equipment monitoring of access medicine cabinets and medicine racks, dosing systems, horizontal power medicine troughs and belt transmission systems. For various types of problems such as drug shortage, filling, conveyor belt deviation or emergency stop, the system is equipped with functions such as independent analysis and prediction, positioning and quantitative replenishment, abnormal alarm shutdown, and foreign body intelligent identification and alarm to meet the needs of potential problems. Rapid response rate. Strengthen the data closed loop from drug replenishment-drug distribution in pharmacies, and construct an integrated perception system.
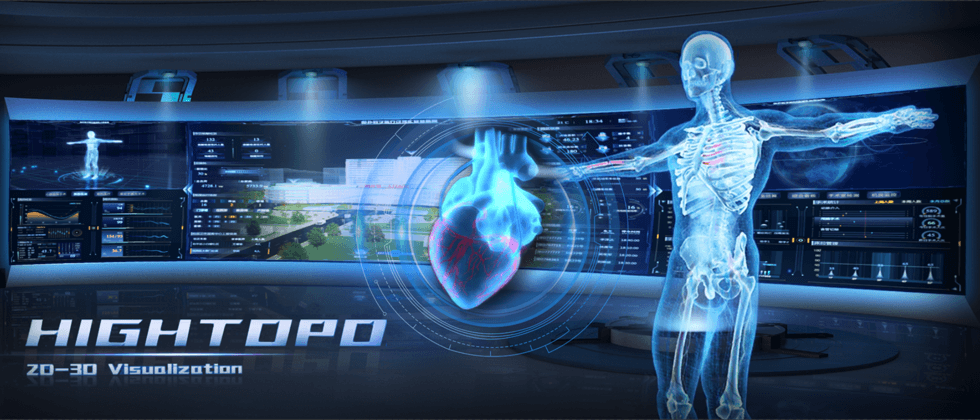
Human monitoring

department monitoring
The HT 3D visual human monitoring panel follows the gender differences of the human body, and uses wireframe technology to construct and restore two-dimensional three-dimensional models of men and women with high precision. After accessing the common disease database information of various parts of the human body, click the button on the left to switch between different departments, and the disease can be displayed in the corresponding part of the model, such as the diseased part of the patient, the problem part indicated by the instrument detection, the patient's main complaint part and other data. It lays the foundation for the intelligentization of remote consultation in the department. It supports to provide query and comparison with the symptoms of related parts, and doctors can evaluate the risk of the disease and intervene in advance according to the feedback data, and scientifically infer the best treatment path.

Click on the patient information on both sides of the panel to pop up the corresponding number, medical history, doctor's order, medicine and other related information. Combined with HT's various visual charts, it displays the patient waiting time, real-time passenger flow data or other information, which can effectively improve the viewing rate according to data statistics. Diagnosis efficiency.
electronic medical record
Tupu software smart hospital visualization system supports the integration of electronic medical records, performs spatiotemporal calibration of multi-source, heterogeneous, and massive data, and conducts multi-dimensional comprehensive monitoring of patient conditions, treatment, outcomes and other data. The construction of electronic file visualization, on the one hand, improves the comfort of medical care and patients and the limitation of regional data sharing, on the other hand, improves the usability of stored information and makes medical data more rigorous. With smart services as the starting point and electronic medical records as the core, the integration of online and offline diagnosis and treatment services will be strengthened to improve the patient's medical experience.
lung monitoring
Traditional CT images have single color, large amount of data, long processing time and difficult interpretation. It is reported that the CT images of each patient with new coronary pneumonia, from admission to the film evaluation - to check the progress - to be cured and discharged, are at least two times, and as many as four times, and a single film has as many as 600 to 800 frames. This is time-consuming and labor-intensive for complex image reading procedures in areas where patients are concentrated, and it is easy for medical staff to be caught off guard.
In life, every second counts. The large HT 3D visualization screen helps to present the images and result analysis of routine organ inspection, and renders the tissue structure of the corresponding organ clearly and realistically, so as to provide its spatial position, size, shape and other three-dimensional features, which can visually help patients and doctors. A vivid and vivid understanding of pathological changes.

Using HT to perform CT image 3D reconstruction technology on the lungs, accurately reproduce local features such as lung lobes and lung segments, combined with HT's rich graphic components, real-time display of the extent of bilateral pneumonia on the large screen, 3D quantitative analysis of chest and lungs, human body synthesis 2D charts such as indicators can assist clinicians to quickly compare and analyze and plan diagnosis and treatment plans. In order to help patients effectively understand the virus, a small window video can be set up according to the needs, and the corresponding popular science video can be played according to the type of lung virus diagnosed and the invasion state. Realize the whole-process visual supervision from lesion detection, disease severity judgment, and structured intelligent reporting.
Make full use of 2D and 3D visual images to assist doctors in comprehensive research and judgment of tissue morphology, reduce the probability of missed diagnosis and misdiagnosis, improve work efficiency while reducing workload, and create a new working mode for doctors.
surgical plan
Because the internal structure of the human body is extremely complex and there are individualized and differentiated vascular variations, it is indispensable to ensure that the lesions and their connections are clearly seen before and during surgery. From a technical point of view, the existence of medical data visualization improves the efficiency of review and the accuracy of observation data.
The visualization of the HT surgical plan supports the entire process of diagnosis, treatment, and healing. Starting from medical images, it generates intelligent images that can be analyzed, sensed, and operable in multiple parts such as cardiovascular, cerebrovascular, liver, spleen, stomach, and lungs, and neuromuscular and skeletal systems. It can assist in generating the three-dimensional distribution map of biological tissue microvascular blood perfusion, blood flow velocity, and red blood cell density signals in characteristic frequency bands, and autonomously promote doctors' intuitive and in-depth understanding of the diseased tissue inside the patient's body.
Note: The above is another case of Tupu medical visualization, which can be viewed on the official website of Tupu software for more relevant information.
Preoperative
Taking the preoperative orthopaedic surgery as an example, for musculoskeletal patients, the transparency of the bones can be set to observe the distribution and position of the veins, muscles, and nerves in the arm and the degree of damage. Combined with medical imaging reports, it can help doctors to correctly judge the follow-up of patients' surgery. .
virtual surgery
For the parts that need surgery, the powerful rendering function of the HT engine is used combined with imaging data to perform virtual simulation surgery in a virtual environment through modeling models, helping patients to understand the details of the surgery process. Click on the surgical site to rotate the model, select any angle such as front, back, left, right, up, down, etc., and observe the detailed positional relationship of the disease in a multi-view, three-dimensional, and all-round way. Virtual surgery supports repeated operations and corrections, which can help doctors reduce intraoperative thinking and decision-making time and surgical risks, assist clinical treatment to achieve preoperative planning, intraoperative drills, and intraoperative guidance evaluation, thereby further improving the success rate of surgery.

Not only that, the scene can also provide 3D human anatomy surgery training for clinical teaching, helping to visualize the human body structure. HT supports display in combination with WebVR. By adapting VR equipment, users can match the headset and handle to realize functions such as grasping and moving the equipment through the handle, and provide an immersive surgical training experience. Reproducing the real situation of the diseased area overcomes the problem that students had few hands-on opportunities and only watching but not practicing in the past, shortening the learning curve of surgery, and efficiently collaborating with students to understand the organizational structure and disease characteristics.
Compared with traditional surgical teaching, the visualization of virtual surgical plan has the advantages of non-invasiveness, repeatability, and specifiability, etc., which is crucial to the integrity, accuracy and scientificity of the visual content of medical information.
Intraoperative
Surgery situation
heart:
Taking coronary artery bypass grafting surgery (heart bypass surgery) as an example, the 3D visualization of the heart can avoid complicated surgical positioning based on previous experience. The received cardiac ultrasound image and probe attitude data are analyzed and processed, and then the obtained lesion target position relationship is displayed through the HT visual image. The medical staff can arbitrarily zoom, pan, and rotate the picture through the large screen, multi-time, all-round , Transparent observation of lesion location, size, shape and detailed records of surgery. The 2D panel simultaneously presents the patient's blood pressure and heartbeat, the concentration monitored by the injection and ventilator, extracorporeal circulation machine, and centrifugal pump aids, blood temperature, blood flow or equipment operating power.

Uninterrupted real-time monitoring, to a certain extent, avoids the occurrence of major bleeding, respiratory arrest, arrhythmia and other accidents during heart bypass, valve replacement or some minimally invasive operations. Assisting in improving the probability of successful surgery and shortening the duration of surgery also plays an important clinical value in further developing virtual reality digital intelligent diagnosis and treatment.
ophthalmology:
The visualization of eye excimer laser surgery is to present the three-dimensional images of the patient's eye, cornea, and medical machinery on the large-screen interface. Corneal in-depth analysis data, laser parameters, and five-dimensional eye tracking maps ensure accurate treatment along the trajectory. Laser surgery visualization realizes target monitoring - multi-dimensional imaging - precise diagnosis and treatment, creating a one-stop new working experience for doctors.

environment:
Support the deployment of dynamic monitoring of all aspects of intraoperative operation indicators, such as operating room environment (indoor temperature and humidity, ventilation system), patient information (causes, preoperative physical examination information), patient vital signs monitoring, anesthesia details and intraoperative consumables Intraoperative information and data are collected from other aspects, and displayed on the 2D panels on both sides in real time. When the monitoring value exceeds the standard critical value, the word [orange] will appear immediately and an alarm will be issued, informing the relevant medical staff to pay attention to the response in time.
It can meet the monitoring needs of medical staff for real-time situational awareness of the patient's intraoperative status, emergency response plans, and historical data retrospective, and more intuitively display the operation of recording the treatment process. CT, MRI and nuclear medicine images can be browsed anytime and anywhere, and 3D interactive image reading and diagnosis can be completed without moving to a dedicated workstation. Provide a solid data guarantee for the upper and lower linkages for remote services such as remote imaging, remote consultation, and two-way referral that are urgently needed in the future.
postoperative
Equipped with multiple types of smart sensors and wireless communication technology, it integrates the equipment data of the hospital's internal medical system, and monitors the admission condition, expenses and expenditure statistics, and bed redundancy statistics, or implements 24-hour vital signs monitoring, body fluid monitoring, micro-health monitoring for patients. Multi-dimensional data monitoring such as cycle monitoring. At the same time, doctors and nurses can refer to the content of the electronic medical records, master the patient's past medical history, sensitive drugs, precautions and other contents of doctor's orders, and support the medical staff to complete the whole process of dispensing, measuring, infusion interval, and nursing records.
Apply HT's innovative 3D visualization modeling technology to build an interactive environment for remote switching equipment, and remotely control the start and stop of equipment or other functions. The system can autonomously monitor the patient's postoperative status according to preset conditions, and immediately trigger an alarm device when the set threshold is approached, notifying medical staff to find out and arrive in time.
Medical Kanban
The initial scene is rendered by Tupu's self-developed engine, showing a cool configuration effect, from the Hightopo logo to the earth scene, HT overlays, rotates and scales the 2D and 3D scenes on the editor, and the height component seamless integration.

Main screen display
The Kanban module adopts a sci-fi style, which centrally manages the software and hardware resources of various topics involved in hospital operations, and displays the hospital's infrastructure, surgical conditions, and global patient conditions in a multi-dimensional digital format in the form of 2D and 3D visualization. Create a set of medical unified management carriers in the medical metaverse.

The Hightopo self-developed engine HT combined with GIS presents a spherical map to display and describe the relevant geographic distribution data in the entire earth's surface space. Click the highlighted part of the city to display the location, input number of patients, average age, gender and other related information.
The HT for Web GIS product is intended to solve the realization of the user's GIS project and reduce the user's learning and input cost of GIS. Combined with HT's powerful visualization engine technology, it can realize the overlay display of different map tile data, oblique photography real scenes, 3D refined artificial modeling models, POI and other data. Subvert the development of traditional GIS systems, making development more convenient, data more intuitive, and display more diverse.


The basic medical information is displayed on one screen in the form of data visualization, which makes it easier to understand various types of surgical monitoring, operation duration, operation statistics, bed management, discharge rate and other information. In the case, Tupu has set up surgical monitoring for VAP prevention/onset (VAP is ventilator-associated pneumonia), bloodstream infection virus, urinary infection, severe death, and pressure ulcer occurrence. This content can be adjusted and modified according to the actual situation of the project. to meet the different needs of each hospital.
Operating room monitoring
The operating room is one of the busiest and most important departments in the hospital. Every operation affects the hearts of many people. Every mistake in the operation may cause immeasurable losses. Intelligent management is an urgent need for hospitals. Through the HT visual management platform, functional modules such as surgical information management, equipment information management, and department operation management are interconnected with various information systems in the hospital, and various medical equipment data are collected to achieve multi-angle, Centralized display and data analysis of multi-dimensional patient diagnosis and treatment information, assisting medical staff to make diagnosis and treatment decisions, and operation and maintenance personnel to manage and maintain departments.
Head-up display (HUD), also known as head-up display system, refers to a driver-centered, blind-operated, multi-functional instrument panel. Project important driving information such as speed and navigation onto the windshield in front of the driver, so that the driver can see important driving information such as speed and navigation without looking down or turning his head.

Tupu integrates HUD into medical data visualization, citing its ideas, and displays the operating time of the department, the number of operating tables, the use status of the room, and the idle state of the room in the form of lines. , equipment inspection, inspection and maintenance number, inspection times, maintenance rate and other data are displayed.
Equipment billing
Medical equipment refers to instruments, equipment, appliances, materials or other items that are used alone or in combination on the human body, and also includes required software.
Medical equipment is the basic condition for continuously improving the level of medical science and technology, and it is also an important symbol of modernization. Medical equipment has become an important field of modern medical care. It can be connected to the medical database, and the input patients from the world and the city can be displayed in real time through the HT visualization panel, and the number of outpatient and emergency departments today is displayed in real time. Real-time summary statistics of equipment warranty information and progress in different areas of the park, so that operation and maintenance personnel can quickly understand the equipment maintenance situation. Let the equipment management personnel conduct statistical management on the equipment maintenance costs of different departments. The payment method of settlement and settlement statistics are also displayed accordingly.

Computer room monitoring
HT independently developed by Tupu Software is a web front-end 2D and 3D graphical interface development framework based on HTML5 standard technology. Provides a library of API components from the SDK to industry icons and 3D model resource libraries. Provides data visualization graph component middleware for monitoring field. It is lightweight, efficient, easy-to-use and cross-platform. It truly achieves the seamless integration of 2D and 3D. Designers and programmers use a unified tool collaborative development model to achieve high-speed iteration of product development, and quickly turn ideas into 2D, 2.5D and 3D final interface results.

The computer room can provide managers with data query and can quickly understand the overall operation mode of the computer room, and can also provide effective data basis for managers. If the first abnormal information occurs in the computer room, it can also quickly notify the manager and quickly locate. to deal with. The purpose of the computer room monitoring system is to reduce labor costs and improve the security of the computer room. It provides 7*24 hours of uninterrupted monitoring for the computer room, and can also ensure safety and security services. Through HT visualization, the overall monitoring of the running conditions of all equipment in the computer room, such as line/interface status, storage space occupancy, real-time monitoring of servers, and remaining conditions of the power system, can be realized, and internal real-time monitoring and monitoring of key equipment can be performed. Alert plan.
Summary of alarms
The computer room alarm is the biggest event in the computer room. After a fault or damage occurs, it can quickly alarm to remind the management personnel. Through the HT visualization, the alarm information such as time, system name, alarm source, alarm content, and level can be displayed in real time. Sending alarm prompts can shorten the failure time, and can also prevent the occurrence of failures to the greatest extent, and also reduce the maximum loss. The number of alarms in a week is counted in the alarm background and displayed in the form of data visualization.

Integrated Kanban
The interconnection of hospitals is to realize the sharing of medical information and resources, and optimize the allocation of medical resources through the standardization of data resources and the construction of interconnection infrastructure.

On the one hand, the comprehensive information management solution of the hospital park under the digital empowerment can meet the needs of digital management in the department, and comprehensively cover the annual comprehensive statistics, online consultation statistics, emergency handling, daily registration statistics, personnel management, department hospital statistics On the other hand, it also meets the needs of information sharing and quality control management among all departments and departments in the hospital. Such as sharing, reviewing and linkage of personnel, departments, medical records, drugs, and equipment cost information.

Combined with HT visualization, comprehensive information can be displayed more diversely, and resources can be managed and shared transparently. You can also directly search for information such as on-duty information of department personnel through the panel, which is convenient for managers to manage and allocate resources in a unified manner.
Summarize
Under the background of the "Internet +" era, aiming at the existing medical pain points, driven by data, with "sensing, knowing, and acting" as the core, vigorously promote the interconnection, integration, openness and sharing of smart hospital facilities and equipment, and break the time and Spatial barriers to realize the interaction between patients and medical staff, medical equipment, and medical institutions.
Hightopo data visualization helps hospitals to build a unified management of perception, integration, analysis, decision-making, execution, and security at multiple levels such as centralized monitoring, auxiliary decision-making, security management, and business linkage, so as to improve the hospital's modern management level and brand services image. With high-quality, safe and convenient diagnosis and treatment methods, the medical resources will sink, and a smart hospital system integrating medical treatment, service and management will be gradually formed.
For more industry application examples, please refer to the case link on the official website of Tupu Software: https://www.hightopo.com/demos/index.html


**粗体** _斜体_ [链接](http://example.com) `代码` - 列表 > 引用。你还可以使用@来通知其他用户。