


Author: Duan Jitong & Xia Lei
Debugging breakpoints is one of the most closely related to the development experience. The Youku iOS team found during external research that a large number of domestic iOS APP R&D teams also encountered similar problems. Considering the current situation of Swift in full swing in China, we sorted out the plan as soon as possible and shared it through this article, hoping to help everyone on this issue.
foreword
As we all know, Swift is a new compiled development language released by Apple at the 2014 Apple Developer Annual Conference (WWDC2014). It supports multiple programming paradigms and can be used to write apps based on macOS, iOS, iPadOS, watchOS and tvOS. For the majority of iOS development students, this is also a language skill that must be mastered in the development of future iOS APP development. The Swift language has grown rapidly in the years since its release, and in 2019 Apple released Swift 5.0 and declared the Swift ABI stable.
After the ABI of Swift 5.0 was stabilized, Swift officially had a sound production and R&D foundation, and the Youku iOS R&D team also began to migrate to Swift for Youku iOS and iPadOS. After Youku was acquired by Alibaba, it received support from a large number of group mobile infrastructure and middleware. Therefore, after several years of continuous evolution, Youku iOS App has basically become a standard large-scale componentized project, with dozens of vertical teams responsible for their respective businesses in parallel. development. Among them, Youku's play details page scene is the most important video content consumption scene, and it is also the first to start the Swift migration of business page framework, player framework and business modules in early 2020.
At the end of 2020, the Youku iOS consumer team completed the Swiftization of the business page framework and the player framework. These two frameworks have less code, the internal code results are reasonable and clear, and there is less external dependence. Therefore, after the complete Swiftization, the performance has been improved, and thanks to the excellent syntax of Swift, the number of lines of code required by the team's development business has decreased, and the team's efficiency has also increased. The whole process was relatively smooth, and no obvious engineering development or quality issues were encountered.
After entering 2021, on the basis of the Swift version of the business page framework and the player framework, the Youku iOS team has fully launched the Swift migration of business layer code. At this stage, the problem of slow debugging breakpoints in Swift began to appear and became increasingly serious. In the video content scenario, the core main business module has more than 70,000 lines of code, and more than 200 external modules rely on various modules. In this business module, the time of the first breakpoint can reach more than 180 seconds under severe conditions, and the team's R&D efficiency is severely restricted. .
At the beginning of 2022, the Youku iOS team completed the Swift migration of more than 80% of the business code. The problem of slow debugging of the first breakpoint has become an efficiency bottleneck in the business field. In the internal research and development happiness questionnaire, 97% of iOS developers believe that the slow debugging of the first breakpoint is the biggest pain point in the current research and development process. Therefore, solving this problem has also become the primary goal of the Youku iOS team for the year.
Debugging the first breakpoint slow phenomenon and preliminary analysis
The main phenomenon of slow debugging breakpoints in Swift is that when the Xcode project runs, the waiting time for the first breakpoint will be particularly long. In most cases, after the first breakpoint of the project takes effect, the waiting time for the second and subsequent breakpoints is very short, and it can basically be considered that there is no waiting time. However, from the information collected within the team, the performance of different Mac computer development devices and different iOS devices is not consistent, and the waiting time for some students to make a breakpoint after the first breakpoint is also extremely slow.
After this phenomenon or problem frequently occurred within the team, we first communicated with the external senior iOS development team and attached detailed engineering documents. The other party also conducted an internal investigation and verification based on the feedback, and finally gave us a reply, saying that there was no similar problem found internally. During the communication process, we found that its internal large-scale APP engineering model is a traditional single-engineering model, which is completely different from the domestic componentized multiple engineering model. Based on the aggregated information from various aspects, we begin to conduct a preliminary analysis and solution to this problem.
It can be analyzed from the table below that the breakpoint time seems to be proportional to the number of external dependencies, so it can be preliminarily concluded that there is a difference between the breakpoint time and the number of external dependencies. strong correlation.

In addition, there is another phenomenon. If the sub-project and the module of the SDK on which the shell project depends are not aligned, lldb will breakpoints take effect soon, but print an error message and cannot po any value. This phenomenon can also be preliminarily analyzed. At the breakpoint, lldb scans the modules that the subproject depends on.
But relying only on the appearance analysis is not enough, so we will start from two directions in the follow-up work. The first is to start the decoupling test of the playback main business module, quickly decouple the external dependencies of the playback main business module, and reduce the number of test couplings. Whether the time can be helpful; the second is from the analysis of lldb's own breakpoint principle, to see what action lldb is doing during the first breakpoint for such a long time.
Start with business module decoupling
We quickly cleaned up the external module dependencies by deleting and sorting out the reference code of project dependencies, and finally reduced the external dependencies of the main business module to about 90. After finishing the arrangement, the first debugging breakpoint time of the main broadcast service has also been reduced from about 200 seconds to about 120 seconds, which has alleviated the current situation of team development difficulties. However, after actual verification and application, we also found that this method of relying on the decoupling of the business layer is not feasible for the team. There are two fundamental reasons:
1. High cost of renovation
The main business module of playing has been reduced from more than 200 modules to more than 90 modules. On the one hand, it has played a positive role in preventing engineering corruption. On the other hand, under the pressure of business needs, R & D personnel need to invest a lot of energy to carry out Code refactoring and decoupling. In the long run, different vertical business teams face different situations, and the complexity of future business technology requirements is also different. This solution cannot be reused quickly. In terms of labor costs, this plan can only be implemented in the short-term, and cannot be persisted for a long time.
2, the actual income is low
Judging from the benefits obtained, after the external dependencies of the main business module of playback were reduced to more than 90, our original expectation was that the time for debugging the first breakpoint could be reduced by 50% or even lower, but as a result, the external dependencies could not be removed. In this case, the waiting time for the first breakpoint is still more than 120 seconds, which is unacceptable for us. Therefore, it is also concluded that under the large-scale componentized multi-project model like Youku iOS, we cannot solve this problem by decoupling business modules.
Getting Started with LLDB Analysis
After engineering governance, we feel that we should overcome this problem from the front, and analyze the root cause and solve it from LLDB analysis. If you want to start by analyzing LLDB, the best way for engineers is to look at the Swift source code and run it to see the internal prototype mechanism. We first download the source code according to Apple's documentation, and then configure it. For specific documentation, please refer to How to Set Up an Edit-Build-Test-Debug Loop, and you can follow it step by step.
Since Swift relies on LLVM and has made its own customized development based on it, switching branches cannot only switch the Swift source code. It is necessary to switch LLVM to the corresponding branch together to ensure code synchronization. It just so happens that Swift provides corresponding tools to help us switch the corresponding branch, just run the utils/update-checkout related commands under the Swift file. The Youku iOS team is currently using Swift 5.4, and the corresponding Xcode version is 13.2.1.
1. Use LLVM's own time-consuming tools
If you want to see which block is the most time-consuming after the breakpoint is hit, you need to use a tool to calculate the time-consuming, and this LLVM has its own tool class TimeProfiler, which encapsulates the timing method and outputs the relevant json file. Then you can use the tracing tool that comes with chrome to parse the real related charts
 //TimeProfiler.h
void timeTraceProfilerBegin(StringRef Name, StringRef Detail);
void timeTraceProfilerBegin(StringRef Name,
                            llvm::function_ref<std::string()> Detail);
void timeTraceProfilerEnd();
2. The two most time-consuming places
Through TimeProfiler, the key functions are time-consuming and buried, and it is found that there are two functions that take more time. The following code:
 // SwiftASTContext.cpp
bool SwiftASTContext::GetCompileUnitImportsImpl(
    SymbolContext &sc, lldb::StackFrameWP &stack_frame_wp,
    llvm::SmallVectorImpl<swift::AttributedImport<swift::ImportedModule>>
        *modules,
    Status &error)
// SymbolFileDWARF.cpp
void SymbolFileDWARF::FindTypes(
ConstString name, const CompilerDeclContext &parent_decl_ctx,
uint32_t max_matches,
llvm::DenseSet<lldb_private::SymbolFile *> &searched_symbol_files,
TypeMap &types)One is the GetCompileUnitImportsImpl method of the SwiftASTContext class. This method mainly parses the operations related to the Module in the current compilation unit. In the end, the operations of these two functions are related to the binary dependency analysis of the current project, so if the analysis of dependencies after the breakpoint is hit can be reduced, the breakpoint time will be faster.
invalid solution
Based on the above analysis of the source code, we initially considered whether we could skip the scanning of some modules through some options of the compiler, so as to improve the speed of the first breakpoint and solve it as soon as possible at a relatively small cost.
Invalid Scenario 1 - Modification of Compile Options
Through the analysis of the compilation log, a parameter -serialize-debugging-options was found during construction. Judging from the name, it was serialized to generate debugging related products when it was used for debug debugging, and then we found it through the swiftc -frontend --help command. the following option:

For this parameter, we tried to add this parameter to Other Swift Flags in the Xcode build settings, but it didn't work from the results. So we checked internal and external information again, and posted on the official Swift forum for consultation. One of the foreign iOS developers replied that they needed to add a custom flag SWIFT_SERIALIZE_DEBUGGING_OPTIONS=NO. Then we immediately added this option to the Xcode project and verified it. From the actual results, the speed of the first breakpoint has been significantly improved, but at the same time, serious defects have been found. When the teammates want po to print the relevant variables, they can't type anything, and lldd can't parse it directly. From the perspective of practical development, this solution is not good.
Invalid Scenario 2 - Modifications to Dependent Libraries
When we built lldb to debug the project, since the compiled lldb is a debug package, when the breakpoint is hit, lldb will print some debug log information. Among them, a bunch of logs are very eye-catching and will continue to play for dozens of seconds, so we immediately analyze these two logs. The following are some intercepted logs:
 warning: (arm64) /Users/ray/workspace/YouKuUniversal/Pods/SOME/SOME.framework/SOME(SOME9999999.o) 0x00004c50: unable to locate module needed for external types: /Users/remoteserver/build/14695183/workspace/iphone-out/ModuleCache.noindex/2YQ3UYLF0BE3R/UIKit-1XGSPECLTDLOB.pcm
error: '/Users/remoteserver/build/14695183/workspace/iphone-out/ModuleCache.noindex/2YQ3UYLF0BE3R/UIKit-1XGSPECLTDLOB.pcm' does not exist
Debugging will be degraded due to missing types. Rebuilding the project will regenerate the needed module files.
This log is an error reported by one of the dependent libraries. Probably the problem is that the path cannot be found when looking for the modulecache of this library. Because Youku iOS's binary dependency library is generated by Alibaba's remote compilation cluster, when the debug debugging information of this library is generated, its path points to the path of the remote machine. Therefore, searching for the address of this remote server on our local machine must not be found, and then an error is reported.
Through this phenomenon, we guess whether it is because the correct modulecache cannot be found, so that the cache of the Swift dependent library of the entire project of our current project cannot be built correctly, so every breakpoint has to search the dependent library again, and then build the cache.
So, where did this path come from? Through research, it is found that this path is in the debug information of the uninstalled Mach-O file DWARF:
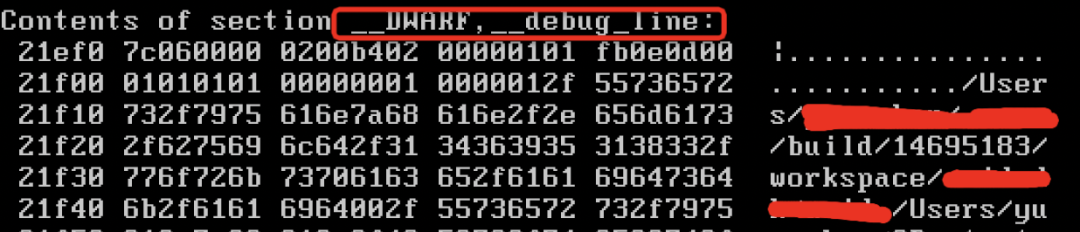
The core is how to deal with this information. It is relatively troublesome to modify it, and you have to get a Mach-O modification tool. The fastest way is to remove this section. There is just this option in the compilation settings that can be removed directly, called Generate Debug Symbol .
Because the log of the error report involves hundreds of libraries, even if changing this option is useful, changing one will definitely have no effect, so we directly modified more than 100 libraries, and put this option in the release compilation environment for these libraries. Change them to NO and try to see if it works.
The results are disappointing. Through our tests, even if so many libraries are changed, the speed of the first breakpoint is not improved, and the problem still exists.
Since neither of these two paths works, does lldb itself have relevant settings? If so, can the settings of lldb take effect?
Effective Solution - LLDB Configuration Optimization
From the above analysis of lldb, we can know that starting from the debugging of the first breakpoint, the time from execution to the breakpoint's official entry mainly includes two parts, most of which are module-dependent analysis and construction of modules, and the other part is the self-Any Any Type parsing. Since the engineering of business decoupling and the configuration modification of compilation options are clearly infeasible, then we consider starting from lldb itself and find all the setting items related to Swift debugging through the setting list command. Among them, we found that there are two most critical ones. indivual:
memory-module-load-level
The level of loading module information from memory during debugging. The default is complete. There are also partial and minimal, of which minimal is the fastest.
 memory-module-load-level            -- Loading modules from memory can be
                                         slow as reading the symbol tables and
                                         other data can take a long time
                                         depending on your connection to the
                                         debug target. This setting helps users
                                         control how much information gets
                                         loaded when loading modules from
                                         memory.'complete' is the default value
                                         for this setting which will load all
                                         sections and symbols by reading them
                                         from memory (slowest, most accurate).
                                         'partial' will load sections and
                                         attempt to find function bounds
                                         without downloading the symbol table
                                         (faster, still accurate, missing
                                         symbol names). 'minimal' is the
                                         fastest setting and will load section
                                         data with no symbols, but should
                                         rarely be used as stack frames in
                                         these memory regions will be
                                         inaccurate and not provide any context
                                         (fastest).
use-swift-clangimporter
Whether to rebuild the dependent module when Swift is debugging, the default value is true.
 use-swift-clangimporter      -- Reconstruct Clang module dependencies from
                                 headers when debugging Swift code
So we start with the above two configuration items and execute the following two commands when any breakpoint is hit:
 settings set target.memory-module-load-level minimal
settings set symbols.use-swift-clangimporter false
After execution, it is found that the breakpoint speed is significantly improved. The first breakpoint is shortened from 180 seconds to 40 seconds. The two commands are tested separately. The memory-module-load-level setting is optimized for about 6 seconds. Other time optimizations come from use-swift-clangimporter set up. After demonstrating this method, based on this configuration, we recruited Youku and iOS students within the group to try it out. After verifying different development environments, we were pleasantly surprised to find that the first breakpoint time has been greatly improved, basically reaching the usable level.
The internal verification results of Alibaba Group are shown in the figure:

Problems and solutions after configuration optimization
Of course, after making the above optimization settings, we also found a problem, there will be some OC properties that cannot be po, such as the case where Swift inherits the OC base class:
//oc
@interface OPVideo : NSObject
@property (nonatomic, strong) NSString *sid;
@end
//swift
@objc public class DetailVideoSwift: OPVideo {
@objc public var desc: String?
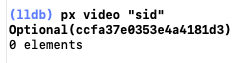
}At this time, "po video.sid" cannot be output, but "po video.desc" is normal, which leads to great limitations in debugging. By consulting the lldb documentation, it is found that lldb can bind the specified code to the custom command, so we can use this mechanism to solve the problem that some properties cannot be po.
First, create a new Swift code base. When external students refer to it, you can put it into the relevant basic library of your own project, and implement the method in the library:
 public func aliprint(_ target:Any?,selector:String?){
    if let target = target as AnyObject?{
        if let selector = selector {
            let returnValue = target.perform(NSSelectorFromString(selector))
            print("(String(describing: returnValue?.takeUnretainedValue()))")
        }else{
            print("(String(describing: target))")
        }
    }
}
After packaging, add the module SDK containing the code to the main project dependency, and then pass the command
command regex px 's/(.+) (.+)/expr -l Swift -O -- import AliOneUtils; aliprint(%1,selector:%2);/'Bind the px command to the aliprint method, note that px is a custom command here, which solves the problem that some properties cannot be po, and is fully available after testing:
Summarize
As the pioneer of Swift migration within Alibaba, Youku iOS team encountered many problems in the process of Swift migration, and also summed up a lot of experience. Debugging breakpoints is one of the most closely related to the development experience. During our external research, we found that a large number of domestic iOS APP R&D teams also encountered similar problems.
Considering the current situation of Swift in full swing in China, we sorted out the plan as soon as possible and shared the outside, hoping to help everyone on this issue. At the same time, if there are more excellent solutions from the iOS team and the great gods, I hope to share them and jointly help the vigorous development of the domestic iOS Swift development ecosystem.
At present, the investment and research of the Youku iOS team in this direction is only the beginning, and the follow-up will also actively explore the performance experience, compilation speed, package size optimization and other directions, and hope that through the innovation of development efficiency and technology, it will bring users Better quality service experience.
Pay attention to [Alibaba Mobile Technology], Ali's cutting-edge mobile dry goods & practice will give you thoughts!


**粗体** _斜体_ [链接](http://example.com) `代码` - 列表 > 引用。你还可以使用@来通知其他用户。