author
Qiu Tian, senior engineer of Tencent Cloud, responsible for Tencent Cloud TKE dynamic scheduler and rescheduler products.
background
The native kubernetes scheduler can only schedule based on the resource request of the resource. However, the actual resource utilization rate of the Pod is often very different from the request/limit of the requested resource, which directly leads to the problem of uneven cluster load:
- For some nodes in the cluster, the actual utilization rate of resources is much lower than the resource request, but no more Pods are scheduled, which causes a relatively large waste of resources;
- For some other nodes in the cluster, the actual utilization rate of their resources is actually overloaded, but it cannot be perceived by the scheduler, which may greatly affect the stability of the business.
All of these are undoubtedly contrary to the original purpose of enterprises to go to the cloud. They have invested enough resources for the business, but have not achieved the desired results.
Since the root of the problem lies in the "gap" between resource requests and real usage, why can't the scheduler be able to schedule directly based on real usage? This is the original intention of Crane-scheduler design. Crane-scheduler constructs a simple but effective model based on the real load data of the cluster, which acts on the Filter and Score stages in the scheduling process, and provides a flexible scheduling policy configuration method, which effectively alleviates various problems in the kubernetes cluster. Uneven load of resources. In other words, Crane-scheduler focuses on the scheduling level, maximizing the use of cluster resources while eliminating the worries of stability, and truly achieving "cost reduction and efficiency increase".
Overall structure
As shown in the figure above, Crane-scheduler relies on two components, Node-exporter and Prometheus. The former collects load data from nodes, and the latter aggregates data. The Crane-scheduler itself also contains two parts:
- Scheduler-Controller periodically pulls the real load data of each node from Prometheus, and then marks it on each node in the form of Annotation;
- The Scheduler directly reads the load information from the Annotation of the candidate node, and based on the load information, filters the nodes in the Filter stage and scores the nodes in the Score stage;
Based on the above architecture, the effective scheduling of Pods based on real load is finally realized.
scheduling strategy
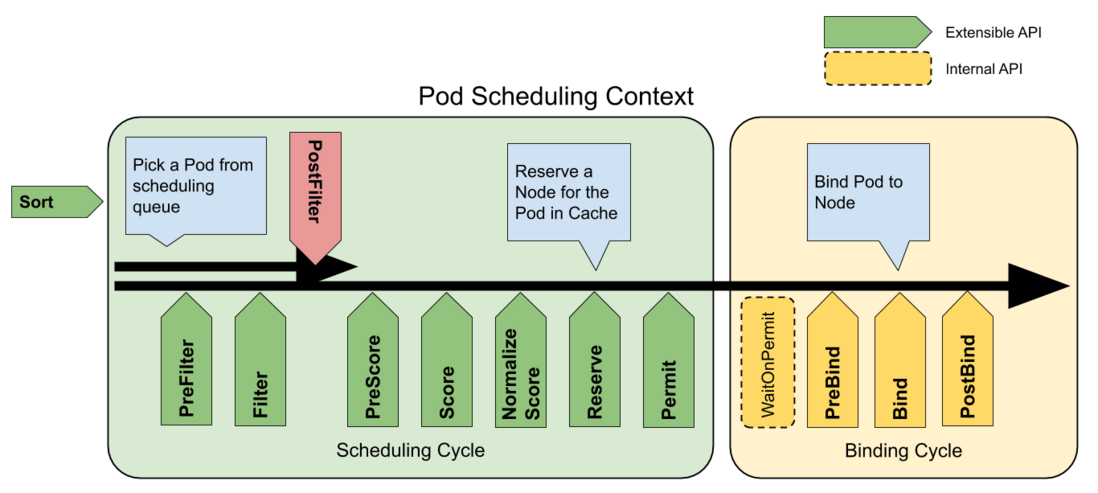
The following figure shows the scheduling context of the officially provided Pod and the extension points exposed by the scheduling framework:
Crane-scheduler mainly acts on the Filter and Score stages in the figure, and provides users with a very open policy configuration. This is also one of the biggest differences between Crane-Scheduler and the same type of scheduler in the community:
1) The former provides a generalized scheduling policy configuration interface, giving users great flexibility;
2) The latter often only supports the perceptual scheduling of a few indicators such as cpu/memory, and the indicator aggregation method and scoring strategy are limited.
In Crane-scheduler, users can configure any evaluation indicator type for candidate nodes (as long as the relevant data can be pulled from Prometheus), whether it is the commonly used CPU/Memory usage, IO, Network Bandwidth or GPU usage, all are It can take effect and supports custom configuration of related policies.
data pull
As described in "Overall Architecture", the load data required by Crane-scheduler is asynchronously pulled through the Controller. This data pull method:
- On the one hand, the performance of the scheduler itself is guaranteed;
- On the other hand, it effectively relieves the pressure on Prometheus and prevents components from being exploded when the business suddenly increases.
In addition, users can directly describe the node and view the load information of the node, which is convenient for problem location:
 [root@test01 ~]# kubectl describe node test01
Name:               test01
...
Annotations:        cpu_usage_avg_5m: 0.33142,2022-04-18T00:45:18Z
                    cpu_usage_max_avg_1d: 0.33495,2022-04-17T23:33:18Z
                    cpu_usage_max_avg_1h: 0.33295,2022-04-18T00:33:18Z
                    mem_usage_avg_5m: 0.03401,2022-04-18T00:45:18Z
                    mem_usage_max_avg_1d: 0.03461,2022-04-17T23:33:20Z
                    mem_usage_max_avg_1h: 0.03425,2022-04-18T00:33:18Z
                    node.alpha.kubernetes.io/ttl: 0
                    node_hot_value: 0,2022-04-18T00:45:18Z
                    volumes.kubernetes.io/controller-managed-attach-detach: true
...
Users can customize the type of load data and the pull cycle. By default, the configuration of data pull is as follows:
 syncPolicy:
    ## cpu usage
    - name: cpu_usage_avg_5m
      period: 3m
    - name: cpu_usage_max_avg_1h
      period: 15m
    - name: cpu_usage_max_avg_1d
      period: 3h
    ## memory usage
    - name: mem_usage_avg_5m
      period: 3m
    - name: mem_usage_max_avg_1h
      period: 15m
    - name: mem_usage_max_avg_1d
      period: 3h
Filter strategy
Users can configure the thresholds of related indicators in the Filter policy. If the current load data of a candidate node exceeds any of the configured indicator thresholds, the node will be filtered. The default configuration is as follows:
 predicate:
    ## cpu usage
    - name: cpu_usage_avg_5m
      maxLimitPecent: 0.65
    - name: cpu_usage_max_avg_1h
      maxLimitPecent: 0.75
    ## memory usage
    - name: mem_usage_avg_5m
      maxLimitPecent: 0.65
    - name: mem_usage_max_avg_1h
      maxLimitPecent: 0.75
Score strategy
Users can configure the weights of related indicators in the Score strategy. The final score of candidate nodes is the weighted sum of the scores of different indicators. The default configuration is as follows:
 priority:
    ### score = sum((1 - usage) * weight) * MaxScore / sum(weight)
    ## cpu usage
    - name: cpu_usage_avg_5m
      weight: 0.2
    - name: cpu_usage_max_avg_1h
      weight: 0.3
    - name: cpu_usage_max_avg_1d
      weight: 0.5
    ## memory usage
    - name: mem_usage_avg_5m
      weight: 0.2
    - name: mem_usage_max_avg_1h
      weight: 0.3
    - name: mem_usage_max_avg_1d
      weight: 0.5
Scheduling Hotspots
In the actual production environment, after the Pod is successfully created, its load will not increase immediately, which leads to a problem: if the Pod is scheduled completely based on the real-time load of the node, there will often be scheduling hot spots (a large number of pods are scheduled to on the same node). In order to solve this problem, we set up a single-column indicator, Hot Vaule, to evaluate the frequency of a node being scheduled in the recent period, and to hedge the real-time load of the node. The Priority of the final node is the Score in the previous section minus the Hot Value. The default configuration of Hot Value is as follows:
 hotValue:
    - timeRange: 5m
      count: 5
    - timeRange: 1m
      count: 2
Note: This configuration means that if the node is scheduled with 5 pods within 5 minutes, or 2 pods within 1 minute, HotValue will add 10 points.
Case Studies
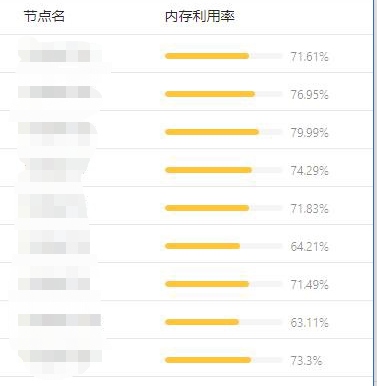
Crane-scheduler is currently used by many public cloud users, including Douyu Live, Kugou, FAW-Volkswagen, Cheetah Mobile and other companies, and they have given good feedback on the product. Here we first share a real case of a public cloud user. Most of the services in this customer cluster are memory-consuming, so nodes with high memory utilization are prone to appear, and the distribution of memory utilization of each node is also very uneven, as shown in the following figure:
After knowing the user's situation, we recommend that they use Crane-scheduler. After the component runs for a period of time, the memory utilization data distribution of each node in the user's cluster has changed significantly, as shown in the following figure:
It can be seen that the memory usage of the user cluster tends to be more balanced.
In addition, Crane-scheduler is also widely used in the self-developed cloud environment of various BGs within the company. The following is the CPU usage distribution of the two production clusters of the internal self-developed cloud platform TKEx-CSIG, in which cluster A does not deploy Crane-scheduler:
Cluster B has the components deployed and running for a while:
Obviously, in cluster B, the proportion of node CPU usage at both ends (< 10% and > 80%) is significantly smaller than that in cluster A, and the overall distribution is also more compact, which is relatively more balanced and healthy .
Derivative Reading: What is Crane
In order to promote cloud native users to achieve the ultimate cost reduction on the basis of ensuring business stability, Tencent launched the industry's first cost optimization open source project based on cloud native technology Crane (Cloud Resource Analytics and Economics). Crane follows FinOps standards and aims to provide cloud-native users with a one-stop solution for cloud cost optimization.
Crane-scheduler, as Crane's scheduling plug-in, implements the scheduling function based on real load, and aims to help business reduce costs and increase efficiency from the scheduling level.
Recently, Crane successfully joined CNCF Landscape, welcome to follow the project: https://github.com/gocrane/crane .
about us
For more cases and knowledge about cloud native, you can pay attention to the public account of the same name [Tencent Cloud Native]~
Welfare:
① Reply to the [Manual] in the background of the official account, you can get the "Tencent Cloud Native Roadmap Manual" & "Tencent Cloud Native Best Practices"~
②The official account will reply to [series] in the background, and you can get "15 series of 100+ super practical cloud native original dry goods collection", including Kubernetes cost reduction and efficiency enhancement, K8s performance optimization practices, best practices and other series.
③If you reply to the [White Paper] in the background of the official account, you can get the "Tencent Cloud Container Security White Paper" & "The Source of Cost Reduction - Cloud Native Cost Management White Paper v1.0"
④ Reply to [Introduction to the Speed of Light] in the background of the official account, you can get a 50,000-word essence tutorial of Tencent Cloud experts, Prometheus and Grafana of the speed of light.
[Tencent Cloud Native] New products of Yunshuo, new techniques of Yunyan, new activities of Yunyou, and information of cloud appreciation, scan the code to follow the public account of the same name, and get more dry goods in time! !


**粗体** _斜体_ [链接](http://example.com) `代码` - 列表 > 引用。你还可以使用@来通知其他用户。