Under the distributed and microservice architecture, one application request often runs through multiple distributed services, which brings new challenges to application troubleshooting and performance optimization. As an important technology to solve the observability problem of distributed applications, distributed link tracing has increasingly become an indispensable infrastructure for distributed applications. This article will introduce the core concepts, architectural principles and related open source standard protocols of distributed links in detail, and share some of our practices in implementing non-intrusive Go collection SDKs.
Why a Distributed Link Tracking System is Needed
Microservice architecture brings new challenges to O&M and troubleshooting
Under the distributed architecture, when a user initiates a request from the browser client, the back-end processing logic often runs through multiple distributed services. At this time, many problems will arise, such as:
- The overall request takes a long time. Which service is the slowest?
- An error occurred during the request. Which service reported the error?
- What is the request volume of a service and what is the success rate of the interface?
Answering these questions is not so simple. We not only need to know the interface processing statistics of a certain service, but also need to understand the interface invocation dependencies between two services. Only by establishing the spatiotemporal order of the entire request between multiple services , in order to better help us understand and locate the problem, and this is exactly what the distributed link tracking system can solve.
How a distributed link tracking system can help us
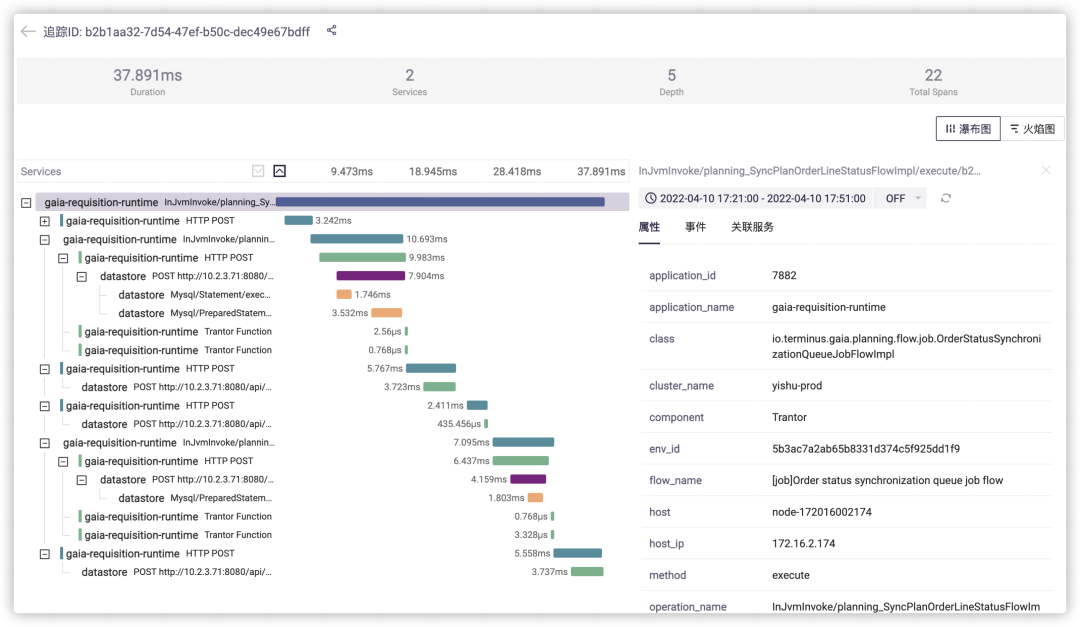
The core idea of distributed link tracking technology: in the process of invoking a distributed request service by a user, the invocation process and time-space relationship of the request among all subsystems are tracked and recorded, and restored to a centralized display of invocation links. The information includes The time-consuming on each service node, which machine the request arrives on, the request status of each service node, and so on.
As shown in the figure above, after constructing a complete request link through distributed link tracing, you can intuitively see which service link is mainly spent on request time, helping us to focus on the problem more quickly.
At the same time, the collected link data can also be further analyzed, so as to establish the dependencies between the services of the entire system and the traffic situation, helping us to better troubleshoot the system's circular dependencies, hotspot services and other issues.
Overview of Distributed Link Tracking System Architecture
Core idea
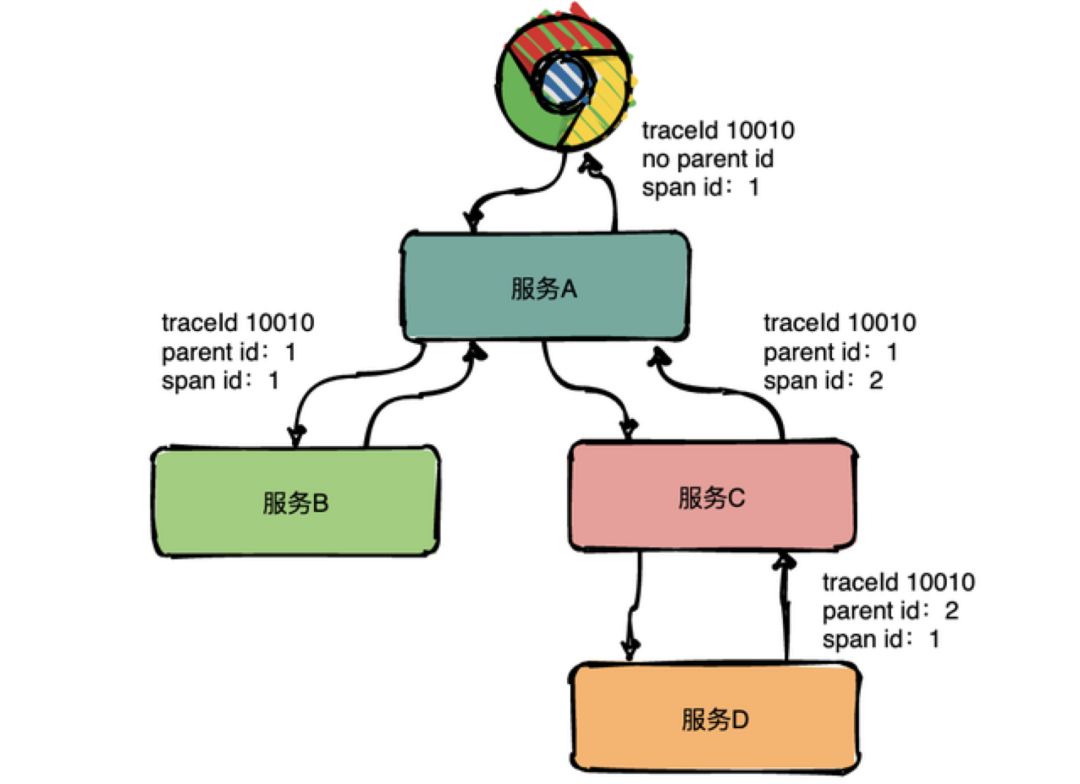
In the distributed link tracking system, the core concept is the data model definition of link tracking, mainly including Trace and Span.
Among them, Trace is a logical concept that represents a complete directed acyclic graph composed of all local operations (Spans) that a (distributed) request passes through, in which all Spans have the same TraceId.
Span is a real data entity model, which represents a step or operation of a (distributed) request process, and represents a logical operation unit in the system. Spans are nested or arranged in sequence to establish a causal relationship. Span data is generated at the collection end, and then reported to the server for further processing. It contains the following key properties:
- Name: Operation name, such as the name of an RPC method, a function name
- StartTime/EndTime: start time and end time, the life cycle of the operation
- ParentSpanId: ID of the parent Span
- Attributes: attributes, a set of <K,V> key-value pairs
- Event: an event that occurred during the operation
- SpanContext: Span context content, usually used to spread between Spans, its core fields include TraceId, SpanId
General Architecture
The core task of the distributed link tracking system is to build a distributed link tracking system around the generation, propagation, collection, processing, storage, visualization, and analysis of Span. Its general architecture is as follows:
- We see that the Tracing Sdk needs to be injected on the application side in an intrusive or non-intrusive way to track, generate, propagate and report the request call link data;
- Collect agent is generally an edge computing layer close to the application side, which is mainly used to improve the writing performance of Tracing Sdk and reduce back-end computing pressure;
- When the collected link tracking data is reported to the backend, it first goes through the Gateway for authentication, and then enters MQ such as Kafka for message buffer storage;
- Before data is written to the storage layer, we may need to perform some cleaning and analysis operations on the data in the message queue. Cleaning is to standardize and adapt the data reported by different data sources, and analysis is usually to support more advanced business functions , such as traffic statistics, error analysis, etc. This part is usually completed by a stream processing framework such as flink;
- The storage layer will be a key point in the design and selection of the server. The data volume and the characteristics of the query scenario should be considered to design the selection. The usual choices include the use of open source products such as Elasticsearch, Cassandra, or Clickhouse;
- On the one hand, the results of stream processing analysis are persisted as storage, and on the other hand, they will enter the alarm system to actively discover problems to notify users, such as the need to send an alarm notification when the error rate exceeds a specified threshold.
What I just talked about is a general architecture. We have not covered the details of each module, especially the server side. It takes a lot of effort to describe each module in detail. Due to space limitations, we focus on the close The Tracing SDK on the application side focuses on how to track and collect link data on the application side.
Protocol standards and open source implementations
We mentioned Tracing Sdk just now. In fact, this is just a concept. When it comes to implementation, there may be many choices. The reasons for this are mainly because:
- The application of different programming languages may use different technical principles to track the call chain
- Different link tracking backends may use different data transmission protocols
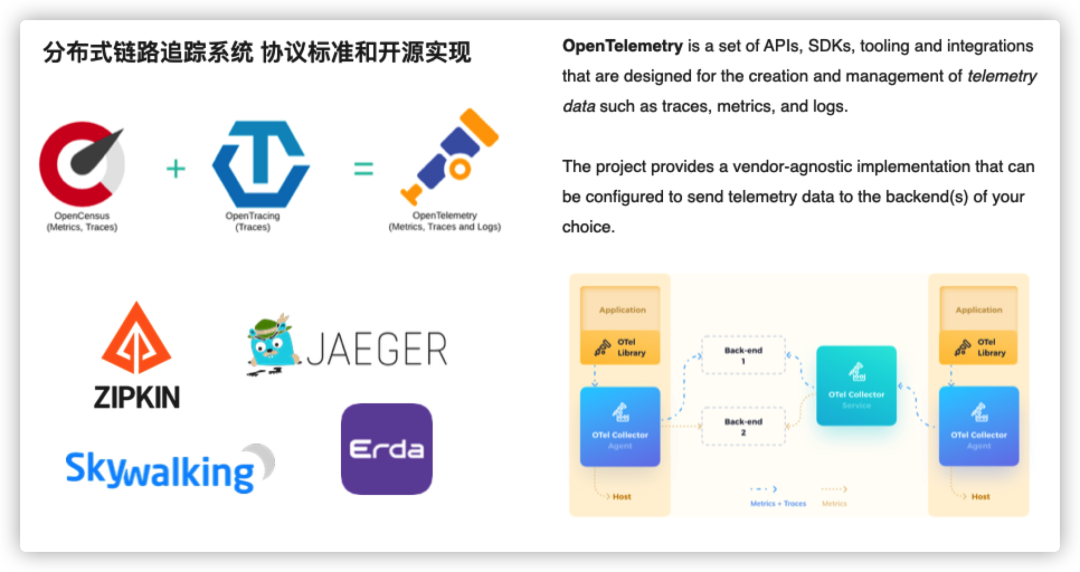
Currently, popular link tracking backends, such as Zipin, Jaeger, PinPoint, Skywalking, and Erda, all have SDKs for application integration, which may lead to major adjustments on the application side when switching backends.
There have also been different protocols in the community, trying to solve this kind of chaos on the acquisition side, such as OpenTracing and OpenCensus protocols. These two protocols also have follow-up support from some big manufacturers, but in recent years, the two have moved towards integration. Unification has produced a new standard OpenTelemetry, which has developed rapidly in the past two years and has gradually become an industry standard.
OpenTelemetry defines standard APIs for data collection and provides a set of out-of-the-box SDK implementation tools for multiple languages. In this way, applications only need to be strongly coupled with the OpenTelemetry core API package, and do not need to be strongly coupled with specific implementations.
Application side call chain tracking implementation scheme overview
Application-side core tasks
The application side revolves around Span, and there are three core tasks to be completed:
- Generate Span: The operation starts to build the Span and fills the StartTime, and when the operation is completed, the EndTime information is filled, during which Attributes, Event, etc. can be added
- Propagation of Span: In-process through context.Context, between processes through the requested header as the carrier of SpanContext, the core information of propagation is TraceId and ParentSpanId
- Report Span: The generated Span is sent to collect agent / back-end server through tracing exporter
To realize the generation and propagation of Span, we are required to be able to intercept the key operation (function) process of the application and add Span-related logic. There are many ways to achieve this, but before listing them, let's take a look at how it is done in the go sdk provided by OpenTelemetry.
Implement call interception based on OTEL library
The basic idea of OpenTelemetry's go sdk to implement call chain interception is: based on the idea of AOP, adopt the decorator mode, replace the core interface or component of the target package (such as net/http) by packaging, and add Span related logic before and after the core call process. . Of course, this approach is intrusive to a certain extent, and it is necessary to manually replace the code call that uses the original interface implementation to wrap the interface implementation.
Let's take an example of an http server to illustrate how to do it in the go language:
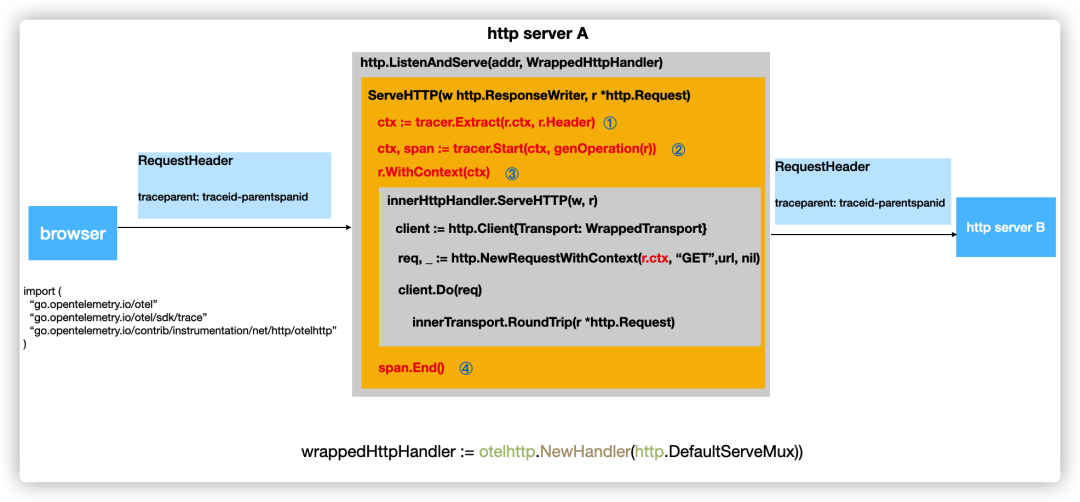
Assuming that there are two services serverA and serverB, after the interface of serverA receives the request, it will further initiate a request to serverB through httpclient, then the core code of serverA may be as shown in the following figure:
Taking the serverA node as an example, at least two Spans should be generated on the serverA node:
- Span1, record a time-consuming situation of the internal overall processing process after httpServer receives a request
- Span2, record the time-consuming of another http request to serverB initiated by the httpServer during the processing of the request
- And Span1 should be the ParentSpan of Span2
We can use the sdk provided by OpenTelemetry to realize the generation, dissemination and reporting of Span. The logic of reporting is limited by the space and we will not go into details. Let's focus on how to generate these two Spans and establish a connection between these two Spans. Association, that is, the generation and propagation of Span.
HttpServer Handler generates Span process
For httpserver, we know that its core is the http.Handler interface. Therefore, it is possible to be responsible for the generation and propagation of Span by implementing an interceptor for the http.Handler interface.
 package http

type Handler interface {
    ServeHTTP(ResponseWriter, *Request)
}

http.ListenAndServe(":8090", http.DefaultServeMux)
To use the http.Handler decorator provided by the OpenTelemetry Sdk, the http.ListenAndServe method needs to be adjusted as follows:
 import (
  "net/http"
  "go.opentelemetry.io/otel"
  "go.opentelemetry.io/otel/sdk/trace"
  "go.opentelemetry.io/contrib/instrumentation/net/http/otelhttp"
)

wrappedHttpHandler := otelhttp.NewHandler(http.DefaultServeMux, ...)
http.ListenAndServe(":8090", wrappedHttpHandler)
As shown in the figure, the following logic will be mainly implemented in wrppedHttpHandler (simplified consideration, this part is pseudo code):
① ctx := tracer.Extract(r.ctx, r.Header) : Extract the traceparent header from the header of the request and parse it, extract the TraceId and SpanId, then construct the SpanContext object, and finally store it in ctx;
② ctx, span := tracer.Start(ctx, genOperation(r)) : Generate a Span that tracks the processing of the current request (that is, the Span1 mentioned above), and record the start time. At this time, the SpanContext will be read from ctx, and the SpanContext.TraceId will be used as the TraceId of the current Span , take SpanContext.SpanId as the ParentSpanId of the current Span, and then write itself into the returned ctx as a new SpanContext;
③ r.WithContext(ctx) : Add the newly generated SpanContext to the context of the request r, so that the intercepted handler can get the SpanId of Span1 from r.ctx as its ParentSpanId property during processing, so that Establish a parent-child relationship between Spans;
④ span.End() : When innerHttpHandler.ServeHTTP(w,r) is executed, it is necessary to record the processing time for Span1, and then send it to the exporter to report to the server.
HttpClient request to generate Span process
Let's look at how the httpclient request from serverA to request serverB generates Span (that is, Span2 mentioned above). We know that the key operation for httpclient to send a request is the http.RoundTriper interface:
 package http

type RoundTripper interface {
  RoundTrip(*Request) (*Response, error)
}
OpenTelemetry provides an interceptor implementation based on this interface. We need to use this implementation to wrap the RoundTripper implementation originally used by httpclient. The code is adjusted as follows:
 import (
  "net/http"
  "go.opentelemetry.io/otel"
  "go.opentelemetry.io/otel/sdk/trace"
  "go.opentelemetry.io/contrib/instrumentation/net/http/otelhttp"
)

wrappedTransport := otelhttp.NewTransport(http.DefaultTransport)
client := http.Client{Transport: wrappedTransport}
As shown in the figure, wrappedTransport will mainly complete the following tasks (simplified consideration, some pseudo-code here):
① req, _ := http.NewRequestWithContext(r.ctx, “GET”,url, nil) : Here we pass the ctx of the request of http.Handler in the previous step to the request to be sent by httpclient, so that we can extract the information of Span1 from request.Context() later, to establish the association between Spans;
② ctx, span := tracer.Start(r.Context(), url) : After executing client.Do(), it will first enter the WrappedTransport.RoundTrip() method, where a new Span (Span2) will be generated, and start recording the time-consuming of httpclient requests. Inside the method, the SpanContext of Span1 will be extracted from r.Context(), and its SpanId will be used as the ParentSpanId of the current Span (Span2), thus establishing a nested relationship between Spans, and the SpanContext saved in the returned ctx will be Information about the newly generated Span (Span2);
③ tracer.Inject(ctx, r.Header) : The purpose of this step is to write the information such as TraceId and SpanId in the current SpanContext into r.Header, so that it can be sent to serverB with the http request, and then established with the current Span in serverB association;
④ span.End() : After waiting for the httpclient request to be sent to serverB and receiving the response, mark the end of the current Span tracking, set the EndTime and submit it to the exporter to report to the server.
Summary of Call Chain Tracking Based on OTEL Library
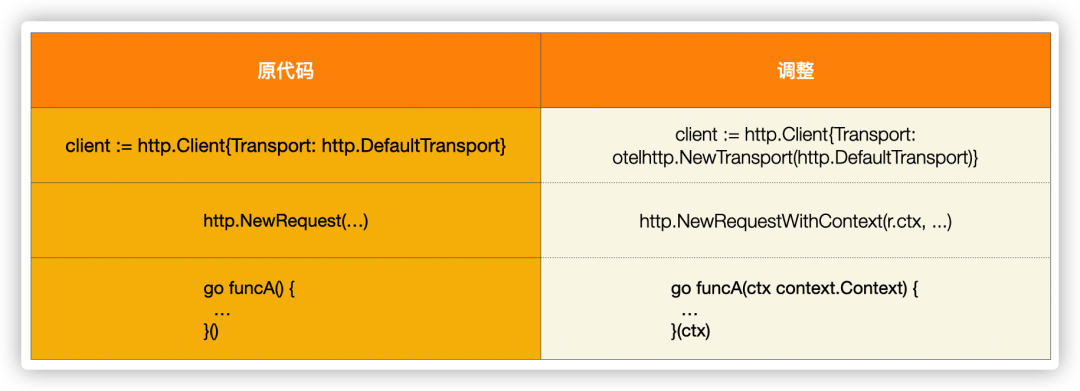
We introduced in detail how to use the OpenTelemetry library to realize how the key information of the link (TraceId, SpanId) is propagated between and within processes. We make a small summary of this tracking implementation:
As shown in the above analysis, using this method is still intrusive to the code, and there is another requirement for the code, which is to keep the context.Context object passed between operations. For example, we just created in serverA When httpclient requests, it uses
http.NewRequestWithContext(r.ctx, ...) instead of http.NewRequest(...) method. In addition, the asynchronous scene of opening goroutine also needs to pay attention to the transmission of ctx.
Implementation idea of non-intrusive call chain tracking
We have just shown a certain intrusive implementation based on routines in detail. Its intrusiveness is mainly manifested in: we need to explicitly manually add code and wrap the original code with a component with tracking function, which further causes the application code to need to be displayed. The specific version of the OpenTelemetry instrumentation package is referenced, which is not conducive to the independent maintenance and upgrade of the observable code.
So do we have any options for implementing non-intrusive tracking call chain?
The so-called non-intrusion is actually only a different way of integration. The goals of integration are actually similar. In the end, it is necessary to achieve interception of key calling functions and add special logic. The point of non-intrusion is that the code does not need to be modified or Very few modifications.
The above figure lists some possible implementation ideas for non-intrusive integration. Unlike programming languages with IL language such as .net and java, go is directly compiled into machine code, which makes the implementation of non-intrusive solutions relatively troublesome. There are the following ideas:
- Compilation phase injection: You can extend the compiler, modify the ast in the compilation process, insert tracking code, and need to adapt to different compiler versions.
- Startup phase injection: Modify the compiled machine code and insert the tracking code, which needs to be adapted to different CPU architectures. Such as monkey, gohook.
- Run-time injection: Through the eBPF capability provided by the kernel, monitor the execution of key functions of the program, insert trace code, the future is bright! For example, tcpdump, bpftrace.
Go non-intrusive link tracking implementation principle
The core code of the Erda project is mainly written based on golang. Based on the OpenTelemetry sdk mentioned above, we implement a non-invasive link tracking method by modifying the machine code.
As mentioned earlier, using the OpenTelemetry sdk requires some adjustments to the code, let's see how these adjustments can be done automatically in a non-intrusive way:
We take httpclient as an example for a brief explanation.
The signature of the hook interface provided by the gohook framework is as follows:
 // target 要hook的目标函数
// replacement 要替换为的函数
// trampoline 将源函数入口拷贝到的位置,可用于从replcement跳转回原target

func Hook(target, replacement, trampoline interface{}) error
http.Client ,我们可以选择hook DefaultTransport.RoundTrip()方法,当该方法执行时, otelhttp.NewTransport()包装起原DefaultTransport ,但需要Note that we cannot directly use otelhttp.NewTransport() DefaultTransport the parameter of ---5728cc302a02a4829af8a1594e78dfa6---, because its RoundTrip() method has been replaced by us, and its original real method has been written In trampoline , so here we need an intermediate layer to connect DefaultTransport and its original RoundTrip method. The specific code is as follows:
 //go:linkname RoundTrip net/http.(*Transport).RoundTrip
//go:noinline
// RoundTrip .
func RoundTrip(t *http.Transport, req *http.Request) (*http.Response, error)

//go:noinline
func originalRoundTrip(t *http.Transport, req *http.Request) (*http.Response, error) {
  return RoundTrip(t, req)
}

type wrappedTransport struct {
  t *http.Transport
}

//go:noinline
func (t *wrappedTransport) RoundTrip(req *http.Request) (*http.Response, error) {
  return originalRoundTrip(t.t, req)
}

//go:noinline
func tracedRoundTrip(t *http.Transport, req *http.Request) (*http.Response, error) {
  req = contextWithSpan(req)
  return otelhttp.NewTransport(&wrappedTransport{t: t}).RoundTrip(req)
}

//go:noinline
func contextWithSpan(req *http.Request) *http.Request {
  ctx := req.Context()
  if span := trace.SpanFromContext(ctx); !span.SpanContext().IsValid() {
    pctx := injectcontext.GetContext()
    if pctx != nil {
      if span := trace.SpanFromContext(pctx); span.SpanContext().IsValid() {
        ctx = trace.ContextWithSpan(ctx, span)
        req = req.WithContext(ctx)
      }
    }
  }
  return req
}

func init() {
  gohook.Hook(RoundTrip, tracedRoundTrip, originalRoundTrip)
}
We use the init() function to automatically add hooks, so the user program only needs to import the package in the main file to achieve non-invasive integration.
值得一提的是req = contextWithSpan(req)函数, req.Context() goroutineContext map中SpanContext ,并Assign it to req , which removes the requirement to use http.NewRequestWithContext(...) .
The detailed code can be viewed in the Erda repository:
https://github.com/erda-project/erda-infra/tree/master/pkg/trace








**粗体** _斜体_ [链接](http://example.com) `代码` - 列表 > 引用。你还可以使用@来通知其他用户。