In June, XMeter released version 3.2.3 of the Enterprise Edition. This version still retains the non-Kubernetes test machine deployment method, that is, pre-installing XMeter's test agent DCM on multiple physical machines or virtual machines to build a horizontally scalable test machine cluster. Enterprises that have no plans to use Kubernetes container clusters in the near future can continue to use the 3.2 series of XMeter to get the latest product optimizations and bug fixes.
Error log viewing experience improved
The following adjustments have been made to the error log in version 3.2.3:
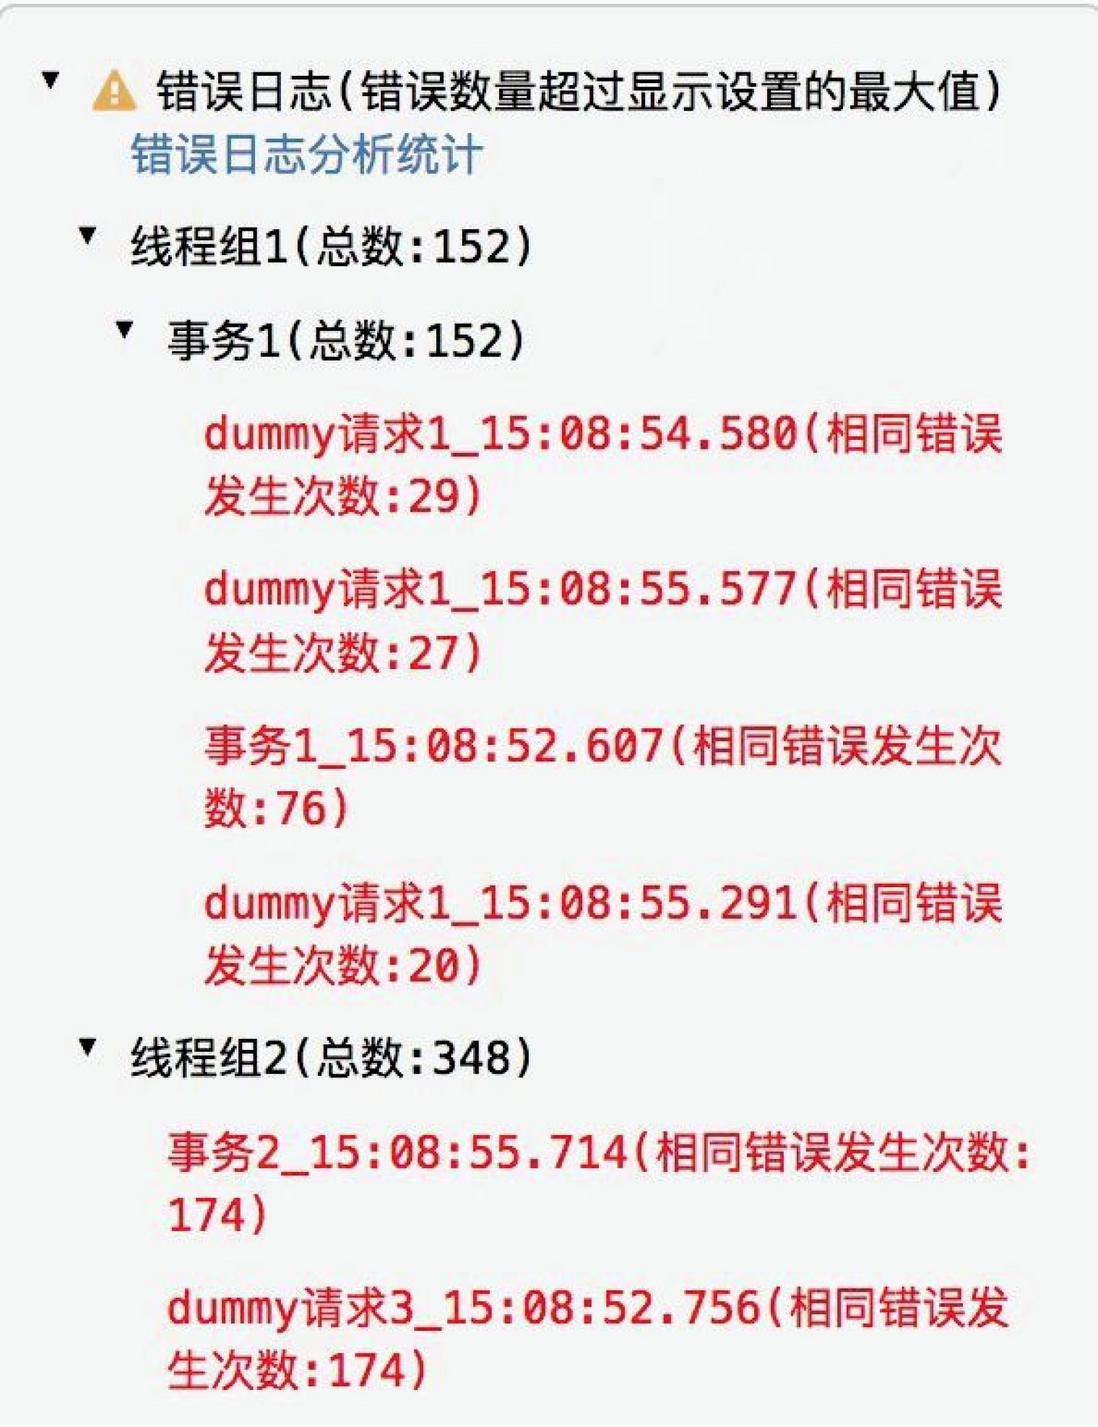
Optimize the existing error log tree display structure
In the error log tree display before version 3.2.3, the same error generated by different test machines may also be displayed as multiple nodes, and each node will be accompanied by container ID information.
Considering that such a display method can easily lead to ambiguity, the 3.2.3 version merges the same errors generated in multiple test machines, and the tree display structure no longer includes container information, only thread group-transaction-request Hierarchical structure.
Added error analysis statistics table
This statistic can be viewed from the Error Log tab of the Test Reports page.
In the error analysis statistics table, under each transaction/request, different errors are displayed in descending order of occurrence. The displayed contents include: the total number of occurrences of such errors, the proportion of all errors in the transaction/request to which they belong, and detailed information such as the error response code and response content.
The default statistics table includes all transactions/requests in the test. If you only want to view some transactions/requests, you can click the "Select Transactions" button and check the required transactions/requests.
Test report chart optimization
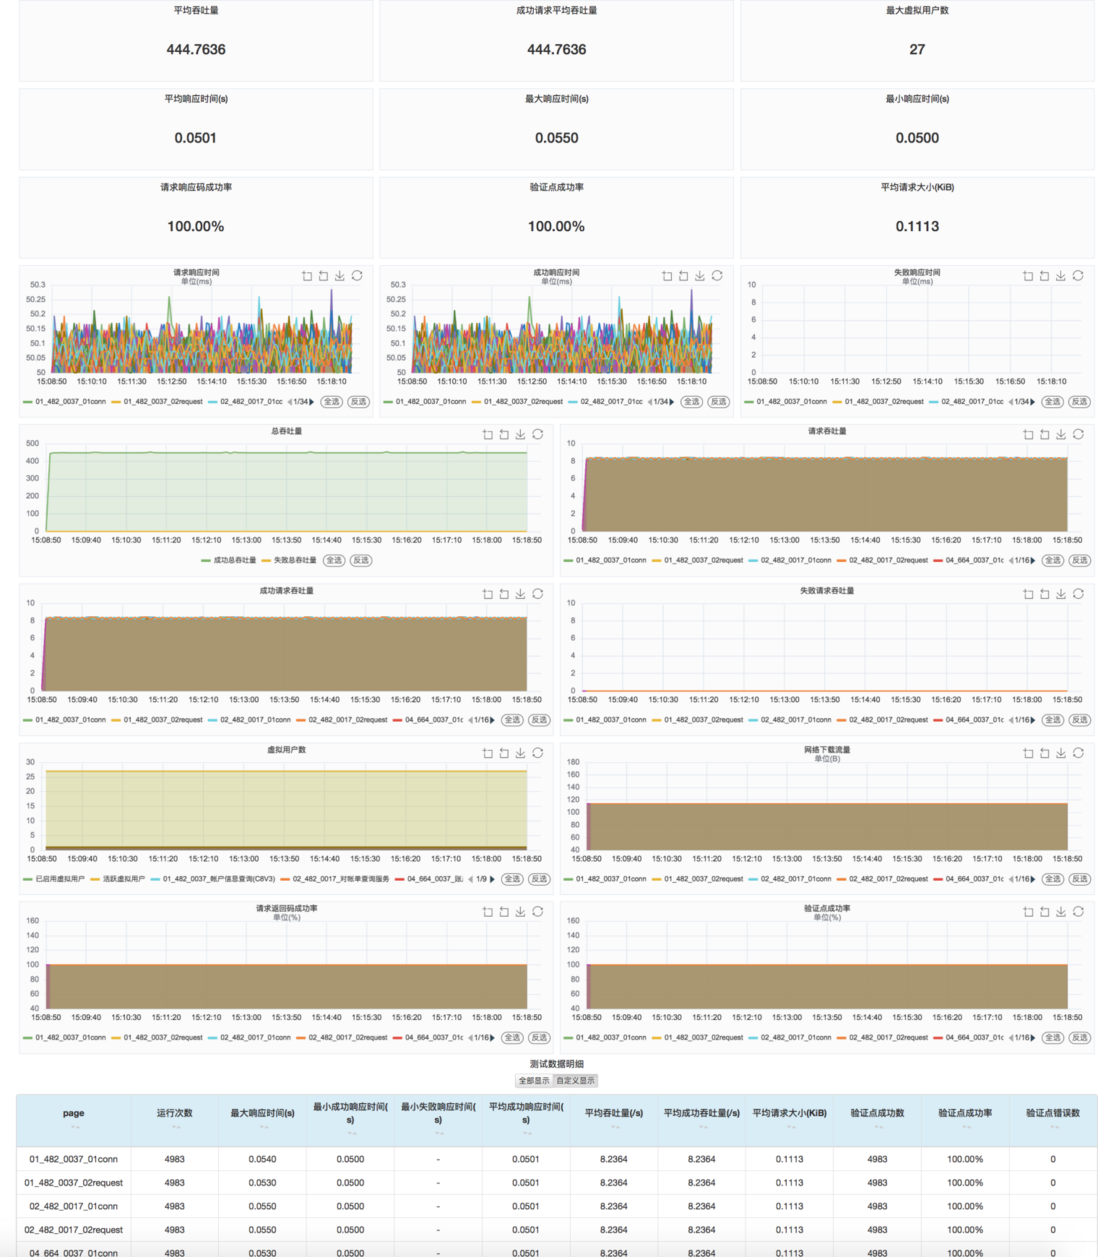
The test report chart consists of three parts: overall test data, line charts of multiple dimensions, and detailed test data for specific transactions/requests. After several iterations of recent versions, the optimization contents of the test chart mainly include:
- When box-selecting a line chart, data linkage of three parts is supported
- Line chart provides select/invert function
- When the line chart is selected in the test run, the regular refresh of the chart will be suspended to solve the conflict with the frame selection function; after the frame selection is canceled, the timed refresh will be automatically resumed
- The line chart of the number of virtual users only shows the virtual users of the thread group where the selected transaction/request is located
- Fixed the problem of incomplete csv and screenshots when exporting test reports and exporting spreadsheet reports
Other optimizations and fixes
- Upgraded versions of dependent software such as ladder test plugin, ZooKeeper, RabbitMQ, etc.
- Fixed incorrect timestamp in press usage chart
- Fixed the problem that the re-uploaded script sometimes cannot display the old test report when opening the old test report
- Fixed the issue that the sending frequency of the Exploration Alarm Emails of Throughput Compression was sometimes inconsistent with the preset
coming soon
A new version of the XMeter Cloud test service is also under development and will be available soon. XMeter Cloud hopes to provide easy-to-use IoT SaaS testing services for customers at home and abroad to reduce test deployment and operation and maintenance costs. The new version will provide a free trial so that you can quickly experience the performance testing service, so stay tuned.
Copyright statement: This article is original by EMQ, please indicate the source when reprinting.
Original link: https://www.emqx.com/zh/blog/xmeter-newsletter-202206


**粗体** _斜体_ [链接](http://example.com) `代码` - 列表 > 引用。你还可以使用@来通知其他用户。