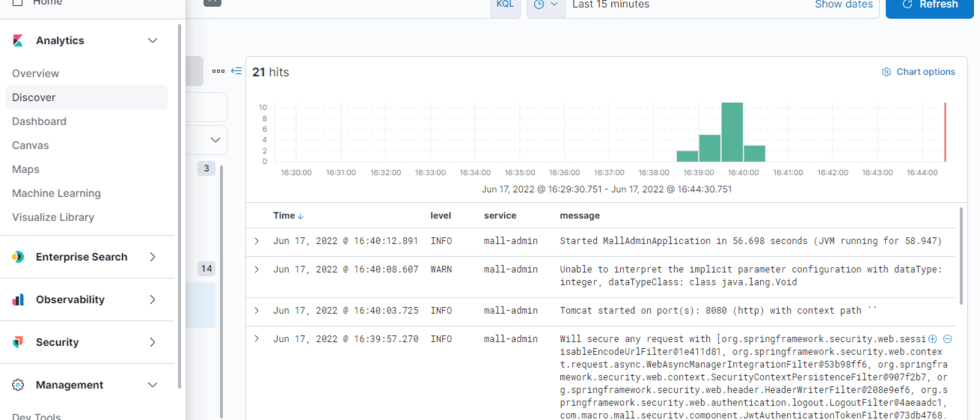
Recently, I upgraded the mall project to support SpringBoot 2.7.0, and at the same time upgraded the entire ELK log collection system. I find that every time I upgrade the Kibana interface, there are certain changes, and it becomes more modern! Today, let's talk about the log collection mechanism of the mall project, using the latest version of ELK supported by SpringBoot, I hope it will be helpful to everyone!
SpringBoot actual e-commerce project mall (50k+star) address: https://github.com/macrozheng/mall
ELK log collection system construction
First, we need to build the ELK log collection system, which is installed in the Docker environment.
- To install and run the Elasticsearch container, use the following commands;
 docker run -p 9200:9200 -p 9300:9300 --name elasticsearch \
-e "discovery.type=single-node" \
-e "cluster.name=elasticsearch" \
-e "ES_JAVA_OPTS=-Xms512m -Xmx1024m" \
-v /mydata/elasticsearch/plugins:/usr/share/elasticsearch/plugins \
-v /mydata/elasticsearch/data:/usr/share/elasticsearch/data \
-d elasticsearch:7.17.3- When starting, you will find that the
/usr/share/elasticsearch/datadirectory has no access rights, you only need to modify the permissions of the/mydata/elasticsearch/datadirectory, and then restart it;
chmod 777 /mydata/elasticsearch/data/- To install and run the Logstash container, use the following command,
logstash.confFile address: https://github.com/macrozheng/mall/blob/master/document/elk/logstash.conf
 docker run --name logstash -p 4560:4560 -p 4561:4561 -p 4562:4562 -p 4563:4563 \
--link elasticsearch:es \
-v /mydata/logstash/logstash.conf:/usr/share/logstash/pipeline/logstash.conf \
-d logstash:7.17.3- Enter the container and install the
json_linesplugin;
 docker exec -it logstash /bin/bash
logstash-plugin install logstash-codec-json_lines- To install and run the Kibana container, use the following commands;
 docker run --name kibana -p 5601:5601 \
--link elasticsearch:es \
-e "elasticsearch.hosts=http://es:9200" \
-d kibana:7.17.3- After the ELK log collection system is started, you can access the Kibana interface. The access address is: http://192.168.3.105:5601
Log Collection Principle
The principle of the log collection system is as follows. First, the application integrates the Logstash plug-in and transmits logs to Logstash through TCP. After Logstash receives the log, it stores the log in different indexes of Elasticsearch according to the log type. Kibana reads the log from Elasticsearch, and then we can perform visual log analysis in Kibana. The specific flow chart is as follows.
The logs are divided into the following four types for easy viewing:
- Debug log (mall-debug): all logs above DEBUG level;
- Error log (mall-error): all ERROR level logs;
- Business log (mall-business):
com.macro.mallall logs above DEBUG level under the package; - Record log (mall-record):
com.macro.mall.tiny.component.WebLogAspectall logs above DEBUG level, this class is an AOP aspect class for statistical interface access information.
start the app
First, start the three applications of the mall project and connect to Logstash through --link logstash:logstash .mall-admin
 docker run -p 8080:8080 --name mall-admin \
--link mysql:db \
--link redis:redis \
--link logstash:logstash \
-v /etc/localtime:/etc/localtime \
-v /mydata/app/admin/logs:/var/logs \
-d mall/mall-admin:1.0-SNAPSHOT
mall-portal
 docker run -p 8085:8085 --name mall-portal \
--link mysql:db \
--link redis:redis \
--link mongo:mongo \
--link rabbitmq:rabbit \
--link logstash:logstash \
-v /etc/localtime:/etc/localtime \
-v /mydata/app/portal/logs:/var/logs \
-d mall/mall-portal:1.0-SNAPSHOT
mall-search
 docker run -p 8081:8081 --name mall-search \
--link elasticsearch:es \
--link mysql:db \
--link logstash:logstash \
-v /etc/localtime:/etc/localtime \
-v /mydata/app/search/logs:/var/logs \
-d mall/mall-search:1.0-SNAPSHOT
other components
The deployment of other components such as MySQL and Redis will not be described in detail. For those who want to deploy a complete set, you can refer to the deployment documentation.
https://www.macrozheng.com/mall/deploy/mall_deploy_docker.html
Visual log analysis
Next, let's experience the visual log analysis function of Kibana. Taking the mall project as an example, it is really powerful!
Create an index matching pattern
- First we need to open Kibana's
Stack管理function;
- Created for Kibana
索引匹配模式;
- You can see that the four log categories we created before have created indexes in ES, and the suffix is the date when the index was generated;
- We need to match the corresponding index through the expression, first create the index matching pattern of
mall-debug;
- Then create the index matching pattern of
mall-error,mall-businessandmall-record;
- Next, open the
发现function in the analysis, and you can see the log information generated in the application.
log analysis
- Let's talk about
mall-debuglogs. This type of log is the most complete log and can be used for debugging in the test environment. When we have multiple services generating logs at the same time, we can use filters to filter out the corresponding logs. Service logs;
- Of course, you can also use Kibana's special query statement KQL to filter;
- Fuzzy query can also be implemented, such as querying the log containing
分页message---77889d07a20bddf3f8eabd2614a87620---, the query speed is really fast;
- Through the
mall-errorlog, you can quickly obtain the error information of the application and accurately locate the problem. For example, if the Redis service is stopped, the log is output here;
- Through the
mall-businesslog, you can view all the DEBUG level and above logs under thecom.macro.mallpackage. Through this log, we can easily view the SQL statement output when calling the interface;
- Through the
mall-recordlog, you can easily view the interface request, including the request path, parameters, return results and time-consuming information, and which interface is slow to access at a glance;
Summarize
Today, I will share with you the log collection solution in the mall project and how to perform log analysis through Kibana. It is indeed much more convenient to go directly to the server and use the command line to view the log. Moreover, Kibana can also aggregate logs generated by different services, and supports full-text search, which is indeed very powerful.
References
For how to customize the log collection mechanism in SpringBoot, you can refer to the fact that you still go to the server to collect logs. Isn't it delicious to build a log collection system!
If you need to protect the log, you can refer to the log that someone wants to prostitute me for free, and quickly turn on the security protection!


**粗体** _斜体_ [链接](http://example.com) `代码` - 列表 > 引用。你还可以使用@来通知其他用户。