Getui has rich data resources, extracts data value through knowledge mining, machine learning and other technologies, and provides data intelligent products and solutions for industry customers.
In order to better ensure its own data quality and provide partners with better data intelligence services, Getui has built hundreds of indicators to monitor data quality, and formed a "data quality electrocardiogram" to visualize the daily increase in data volume, The change trend of the total amount of data, etc., helps relevant personnel to more intuitively discover data anomalies and perceive data quality in a timely manner.
It takes up a lot of human resources to observe and analyze huge indicators manually every day. How to efficiently and accurately identify data anomalies in an intelligent way? This article summarizes Getui's practice in intelligent detection of data outliers, and shares Getui's data quality assurance experience with you.
Four common indicator anomalies
First, according to the personal push business scenario, we summarize and define four common types of data indicator anomalies, namely single-point indicator anomalies, periodic indicators anomalies, ladder indicators anomalies, and continuous indicators anomalies.
Category 1: Abnormal single-point indicators
Anomaly of a single-point indicator refers to data that remains relatively stable most of the time, but suddenly fluctuates greatly at a certain point in time. Taking Getui user portrait data as an example, Getui divides the portrait label data into three types: cold, warm, and hot. "Cold data" refers to gender, age, etc. that will not change significantly for a long time. a type of data. However, if the relevant feature data is missing, the label magnitude of the cold data will plummet. In this case, a single point exception will occur.
Since the value of outliers will greatly deviate from the overall data interval, this type of indicator outliers are easier to identify.
The second category: abnormal cycle indicators
Periodic anomaly means that the data as a whole has periodic characteristics, and periodic fluctuations can be clearly seen on the data curve. Although the abnormal point value is in the normal data range, it does not conform to the consistent periodic fluctuation law.
For example, the daily activity data of office apps has typical cyclical characteristics. Generally speaking, office apps have higher daily activities from Monday to Friday, and lower daily activities on weekends. If the daily activity of office apps suddenly increases during weekends or holidays, or even exceeds working days, then we can consider that there is an abnormal point in the periodic data.
The third category: abnormal ladder indicators
This type of anomaly is not actually all problem data. For example, after the system accesses external advertising traffic, the data curve rises sharply, and then maintains normal fluctuations at the high point. After a period of time, external traffic access is suspended, the data curve plummets, and then maintains normal fluctuations around the point of the plunge. In a similar scenario, the overall data curve shows a step-by-step trend.
Generally speaking, the presence of external traffic access is positive feedback, but the sudden increase in the amount of underlying data requires timely attention to better analyze business development.
Category 4: Abnormal Continuous Indicators
Continuous anomalies are those that occur continuously over a period of time. For example, in the process of switching between the old and new system versions, the daily active data of the old version will continue to drop until it becomes stable after the switching is completed. Then, all points that drop continuously during the switching process should be regarded as outliers.
Such data anomalies have a great impact on the business, and we need to dig out the causes of the anomalies and actively solve them.
The practice of intelligent detection of abnormal indicators
For the abnormality of the above four data indicators, we use algorithms and statistical methods to perform intelligent detection. Several outlier detection methods commonly used at present have been introduced in detail in previous articles. You can click to read >> Several outlier detection methods that big data scientists need to master .
How effective are these outlier detection methods in the actual application of GeTui? What are the differences in the intelligent detection ideas of the four abnormal data indicators? Next, we will introduce them to you one by one.
1. Detection of single-point indicators and continuous indicators anomalies (with certain rules)
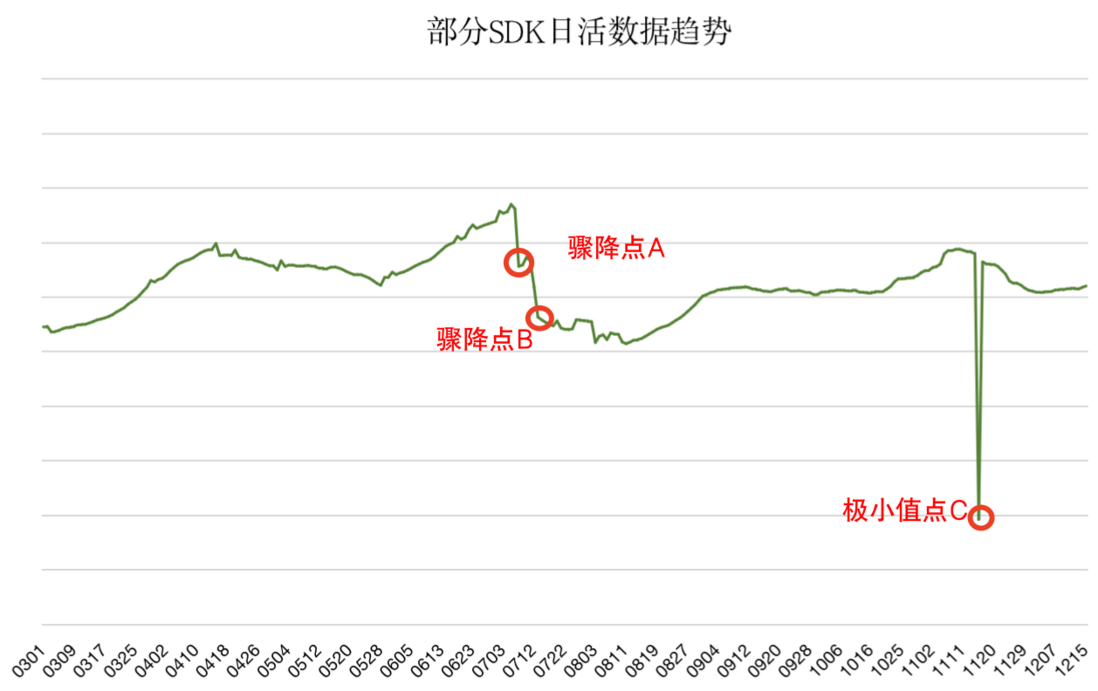
Taking the daily active data of some SDKs of Getui as an example, an app encountered a problem in the process of integrating the Getui SDK, resulting in a continuous dip point A in the daily active data curve; a subsequent system failure caused the SDK daily active data curve to plummet again. (generates a dip point B), and a minimum point C appears. Then the value between the dip point A, the dip point B and the minimum point C is the abnormal point we want to detect.
Typically, statistical models or machine learning models can be used to identify extremely obvious single-point anomalies caused by system failures. As shown in the figure below, both the 3σ statistical method and the isolated forest model can perceive the minimum value point C generated by the system failure.
However, dips A and B due to integration problems were not identified. The reasons behind these dips are of great reference value for our iterative product design, so we need to optimize the detection method so that the model can accurately identify dips A and B.
Analyzing the previous detection scheme, we found that the values of the dip points A and B were both within the normal data fluctuation range, so the statistical method did not divide the dip points A and B outside 3σ, and the isolated forest model could not regard them as Outliers (ie outliers).
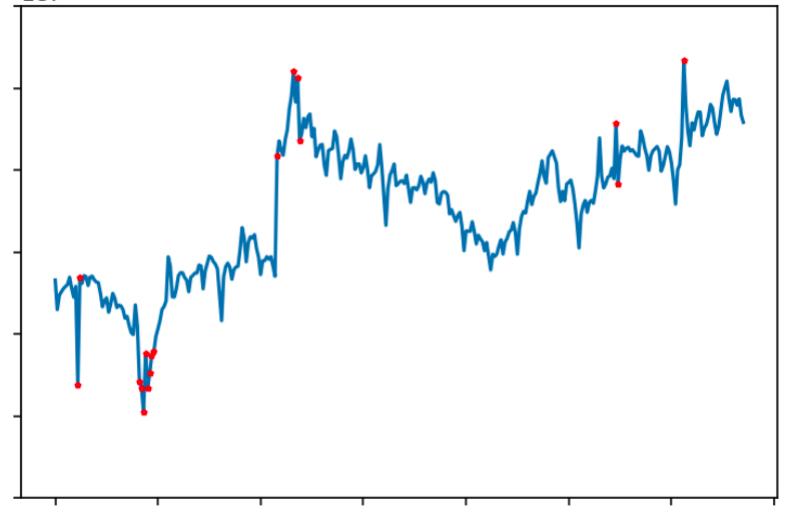
In response to this problem, we adjusted the characteristics of the input model, replaced a single data value with a two-dimensional feature of data value + fluctuation value, and also gave weight to the volatility of the indicator to make it participate in the model calculation; When the parameters are completely consistent, the isolated forest of two-dimensional features is used for comparison.
The above figure shows the detection effect after model optimization. It can be clearly seen that under the condition that the model parameters are consistent, those outliers that drop continuously can be accurately identified, and the minimum points due to system failures can also be successfully detected. The optimized model recognition effect is more in line with the index detection requirements.
Experience summary
Single-point indicator anomalies: For such single-point outliers that deviate significantly from the normal data interval (data in other time periods remain stable), statistical models can be used to identify and detect them.
Abnormal continuous indicators: Because the data values are within the normal range, such abnormal values are relatively hidden, and it is necessary to integrate volatility into the characteristics and participate in the calculation of the isolated forest model to identify them.
2. Abnormal (no obvious regularity) detection of continuous indicators
The abnormal continuous index mentioned just now occurs when the overall data curve is relatively regular, so it is easier to identify; but when the overall data curve has no obvious regularity, the data fluctuates greatly, and the continuous index is abnormal. relatively difficult.
For example, there are many upstream data sources of a certain summary layer (DWS layer), and the logic is complex. Changes in any upstream data will have a direct impact on the summary layer, so the overall data curve fluctuates greatly and has no obvious regularity. Intuitively, there are many abnormal points.
However, the fluctuations caused by data source changes or online optimization are far greater than daily fluctuations, so we need to intelligently identify these large fluctuations caused by the underlying reasons, evaluate the impact in time, and prepare a response plan.
Since the data at the summary layer has no obvious regularity as a whole, the value span of outliers is relatively large and there are many outliers, which can easily shift the normal range of the data, resulting in abnormal indicators being misjudged as reasonable indicators. For this type of data, we use the local outlier factor algorithm (LOF), relying on the model to calculate the characteristics of the local density, and find outliers through the data density of different regions.
From the effect, the abnormal indicators identified by human can be accurately identified by the LOF model, as shown in the following figure:
Lessons Learned The Local Outlier Factor (LOF) algorithm determines outliers by comparing the density of each local data point with the density of data in its adjacent areas.
The smaller the density of local data points is than the density of neighboring data points, the higher the probability of the point being judged as an outlier.
When the overall data is irregular and divergent, using the characteristics of LOF local density to detect outliers is more effective and can meet the index detection standards.
- Staircase index anomaly detection
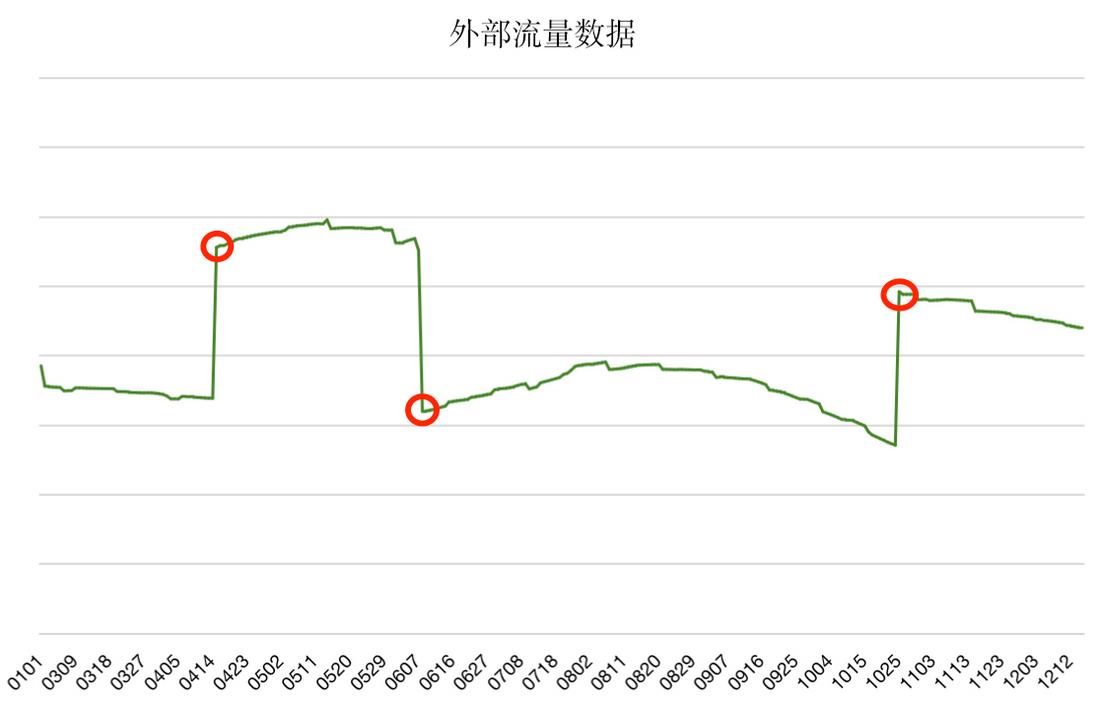
The access data of external traffic is a very typical ladder-type indicator. Taking the external traffic data of Ge Push as an example, in the indicator detection, we should report the fluctuation points generated after access or access as abnormal values.
As shown in the figure above, the abnormality of ladder data occurs in an instant (the rising slope of the data curve is close to 90 degrees), and the numerical fluctuation of the abnormal point is very large and there is repetition.
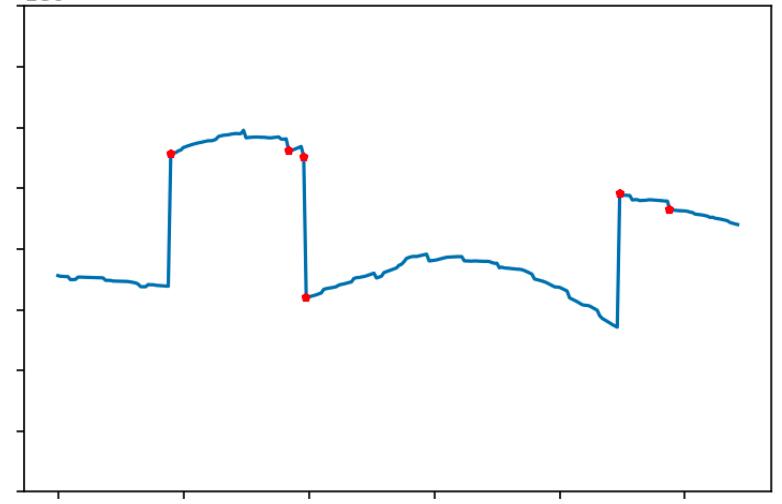
In addition, outliers may be in the normal numerical interval, and the flow data does not conform to a normal distribution. According to the characteristics of ladder anomalies and practical experience, we use the isolation forest model of two-dimensional features to identify this type of anomalies.
The figure above shows the recognition effect. It can be seen that the isolated forest model accurately identifies the change points when the traffic is connected and connected, and also identifies two hidden change points. After zooming in on the curve, it can be found that the fluctuations of these two hidden points are compared with other points. Large, belong to correct identification.
Summary of experience <br>Ladder outliers are relatively hidden, but have high volatility. We can incorporate the volatility value into the features and use the isolation forest model for identification.
4. Periodic indicator anomaly detection
Taking the daily activity data of office apps as an example, the data shows a cyclical period of oscillation most of the time, but a trough occurs during the November holiday and the Spring Festival holiday respectively, and returns to the cycle after the holiday. The data changes caused by the holiday effect are the outliers we are looking for.
After the holiday effect of the Spring Festival ended, the daily activity data of office apps increased, and this improvement point should also be identified.
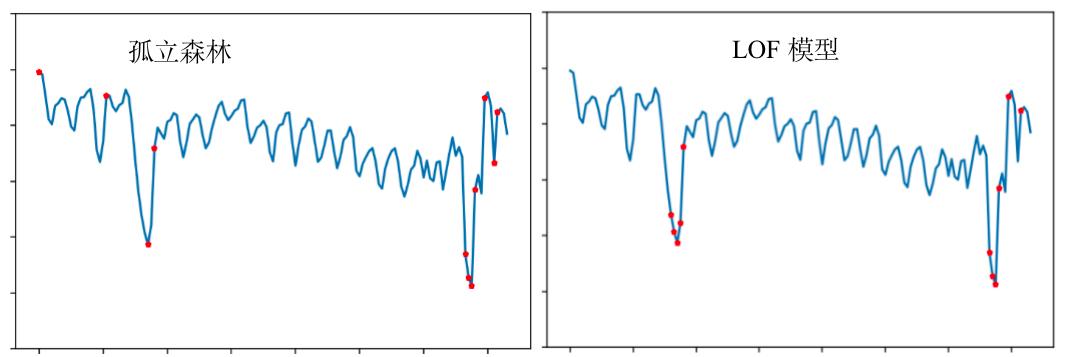
Considering the periodicity, we added the Local Outlier Factor (LOF) algorithm when identifying this type of outliers. In order to verify the effect of the model, on the premise of ensuring the consistency of the two-dimensional features, we used the LOF algorithm and the isolated forest model to identify abnormal indicators, and compared the effects, as shown in the following figure:
As can be seen from the figure above, there is a certain difference in the performance of the two. Both of these two algorithms identified the second cycle anomaly, but in the identification of the first cycle anomaly, LOF used its local density identification characteristics to perceive earlier, in the early stage when it did not conform to the cycle change. Perceived; while the isolated forest was only perceived when the anomaly reached the extreme point in the first cycle.
In practical applications, the earlier the data change is perceived, the more timely measures can be taken to reduce the impact on the business. In addition, the isolation forest model obviously has misjudgment points. Therefore, in contrast, the detection effect of the LOF algorithm is better.
Experience summarizing the detection of abnormal cycle indicators more emphasis on timeliness. From the effect point of view, the LOF model of two-dimensional features can detect abnormalities more accurately and quickly by comparing the density of each local data point.
In general, we can see that the intelligent identification model not only identifies four types of data index anomalies, including single-point index anomalies, periodic index anomalies, step index anomalies, and continuous index anomalies, but also identifies some hidden anomalies. . Simple manual visual inspection may think that these abnormal indicators are caused by misjudgment, but when we zoom in on the curve, we will find that these are the data points that fluctuate the most except for the influence of the underlying data operations.
In fact, you can choose to discard such outliers when building the model. The reason why we keep reporting this kind of data is because we hope to summarize the rules from such data points with large fluctuations, find out the reasons for the large fluctuations in the data without processing the data, and then optimize the data quality and improve the data stability.
Indicator Detection System Architecture
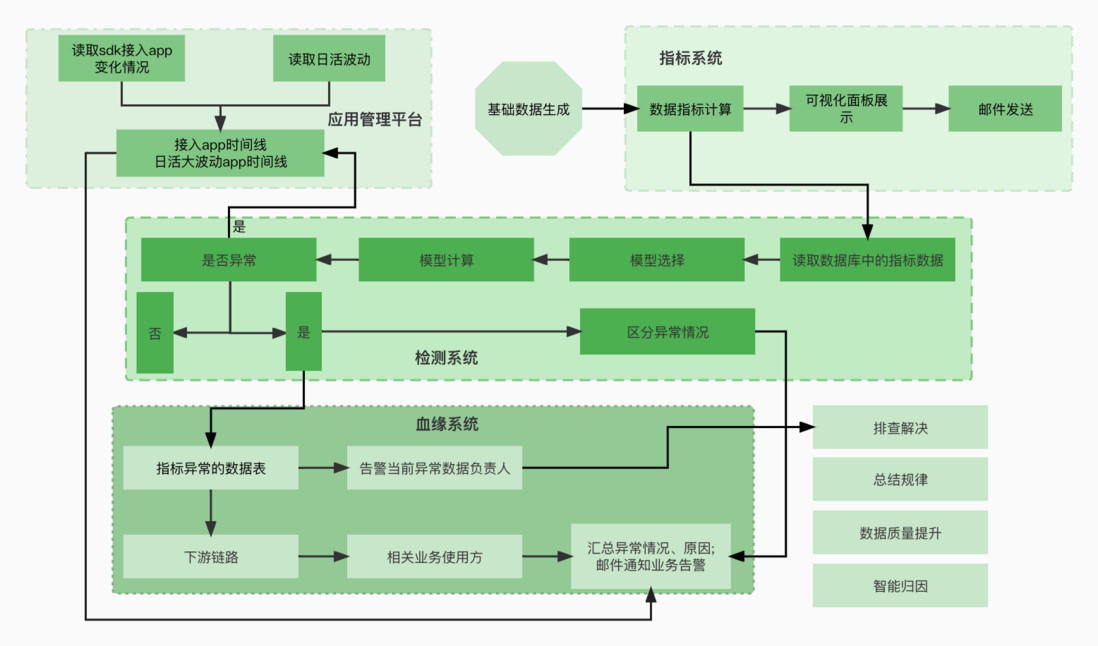
Indicator anomaly detection is only an intermediate process, minimizing the impact of abnormal data and improving data quality is the ultimate goal. To this end, we have made the following planning for the index detection system architecture:
- The application management platform is directly associated with the abnormal data, and the relevant change operations in the abnormal timeline are matched. This operation is likely to be the direct cause of the abnormal data change, and is notified to the responsible person by email.
- For abnormalities that are not caused by changes in the underlying configuration, we need to summarize the internal laws based on business and actual conditions. For example, the daily activity data of office apps is affected by the holiday effect, and analyze the relevant characteristics, establish an attribution model, and finally realize intelligent attribution.
- Combined with the data lineage system, the data lineage system can be used to find the corresponding data owner and the business line that uses the data, and let the business personnel know the changes of the underlying data at the first time, so as to minimize the negative impact.
- Analyze the characteristics of different categories of indicator data, build indicator data classification models, and identify indicator scenarios. Automatically classify anomalies, and match corresponding models according to the results of anomaly classification to perform intelligent identification and reduce manual debugging.




**粗体** _斜体_ [链接](http://example.com) `代码` - 列表 > 引用。你还可以使用@来通知其他用户。