This article was first published on the Nebula Graph Community public account
NebulaGraph VEditor is a high-performance, highly customizable WYSIWYG graph visual editor front-end library.
The bottom layer of NebulaGraph VEditor is based on SVG drawing. It is easy for secondary development and custom drawing through a reasonable abstract code structure. It is very suitable for approval flow, workflow, blood relationship, ETL processing, graph query and other graphs (Graph) and network (Network) WYSIWYG editing and preview scenarios for type topology information. In the NebulaGraph project, VEditor easily supports visualization scenarios such as graph query, graph editing, graph modeling, graph structure, and graph path display.
After continuous iteration and polishing in NebulaGraph, VEditor has been relatively complete, and related codes have been open sourced. Based on this, today I will share with you some of its design ideas and thoughts.
Basic Features
- Highly customizable point, line shape, all parts can be customized
- Flat, simple, straightforward code architecture
- Minimap, Magnetic Lines
- Various shortcut keys support
- history record
- Lightweight, only 160kb before compression
design concept
When I first came into contact with the diagram editing library, my own needs were not high. It could meet customization + animation, but after reading a lot of flowchart libraries in the industry, self-cultivation as a front-end engineer made it difficult to over-design. The architecture, bloated interfaces, and complex class relationships are favorable, which is contrary to my pursuit of simple, streamlined, and low-coupling code concepts. Therefore, I finally decided to write a lightweight library that can meet the customization needs of various business scenarios. The design concept of VEditor is to make it easier for developers to use it on the basis of customizability and understandability, reduce learning of various APIs, and reduce dependence on various libraries.
Technology Architecture
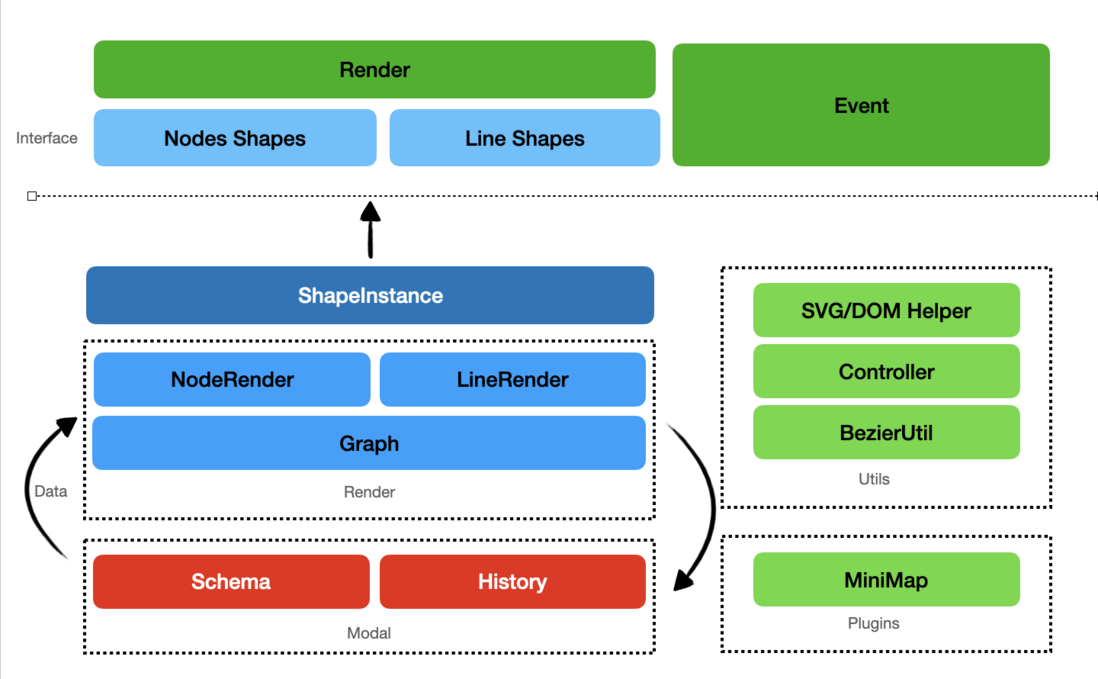
The overall architecture mainly uses events to manage dependencies between entities. It is also recommended to obtain the state changes of the entire flowchart mainly through events.
The rendering process is semi-automatic rendering. After changing the flowchart data, you need to manually trigger the rendering. In other states, the operation of the canvas will trigger the user-defined shape rendering function to complete the custom node rendering node or line rendering.
Rendering implementation
The main body of VEditor uses SVG for rendering. Thanks to the declarative use of SVG, its internal structure is externally visible, and it is very easy to customize its style. Users can directly copy the relevant SVG styles in the outside world. , and can also directly manipulate SVGDOM to monitor related mouse events, and add various animations to certain nodes.
In shape rendering, the user's custom rendering function is registered mainly through the exposed Shape interface. From this point of view, VEditor can render based on any rendering technology, as long as the rendering interface returns SVGDOM, which can be SVGElement or ForeignObject. Therefore, when using a virtual DOM framework such as React or Vue, it is highly recommended to manage the rendering of SVG. In some cases, a Canvas can even be wrapped to render WebGL nodes, which greatly expands the customization in the business.
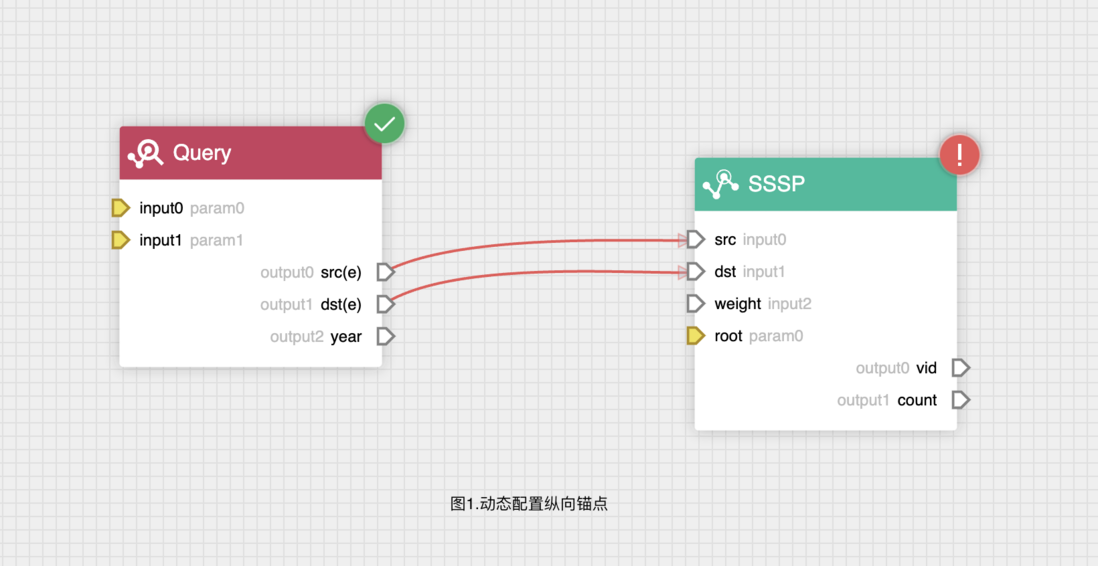
In addition to nodes, anchors and lines also support rendering of objects registered as Shapes after implementing the corresponding interface. Using this feature in our Explorer's actual business, the graph computing flow configuration supports dynamic addition, deletion and modification of algorithm parameters, anchors and TP queries. Input and output anchors (Fig. 1), as well as edge filtering in graph visualization query, step count rendering (Fig. 2). You are also welcome to apply for a trial of Explorer to experience the functions related to the flowchart. The trial address is https://nebula-graph.com.cn/products/explorer/
The overall architecture mainly uses events to manage dependencies between entities. It is also recommended to obtain the state changes of the entire flowchart mainly through events.
The rendering process is semi-automatic rendering. After changing the flowchart data, you need to manually trigger the rendering. In other states, the operation of the canvas will trigger the user-defined shape rendering function to complete the custom node rendering node or line rendering.
data structure design
The data structure of VEditor is similar to most similar libraries, but it will not destroy the user's object reference, that is, when the user mounts the relevant data on the node or line object, it will be aligned and retained, which will facilitate the user to implement such as After node configuration, edge configuration and other operations, the related data is directly mounted to the point data. Therefore, operations such as Redo and Undo in the history record will store the user's data as a snapshot.
 {
    nodes:[{
        uuid:"uuid",
        type:"default",// shape类型
    }],
    lines:[{
        from:"uuid",
        to:"uuid",
        fromPoint:0,
        toPoint:0
    }]
}
performance design
As we all know, the performance of SVG is much worse than that of Canvas in small resolution rendering, which is also a disadvantage brought by the improvement of ease of use. This is especially noticeable when initializing a large number of complex or animated nodes. In response to this situation, the data rendering part of VEditor adopts an asynchronous process, and the rendering of the anchor point is placed in the next event loop to avoid the forced redraw of the browser caused by a large number of acquisitions of bbox during the synchronization process. After finishing drawing, cache the corresponding node data to avoid repeated acquisition.
When adding nodes or lines, the DOM feature of SVG allows the browser to automatically perform dirty rendering. Therefore, the performance of incremental rendering is not different from that of Canvas. The main reason is that a large number of DOM redraws will be slower during interaction and animation. . The performance index currently designed is that 1000 nodes with complex shapes can be rendered smoothly, which is relatively easy in process editing scenarios.
Interactive Design
VEdtior provides a Dagre-based directed graph layout by default, but it is optimized. After calling Dagre layout, all nodes will be automatically centered. At the same time, the adaptive size function is provided. After the adaptive, different from other libraries, the coordinates of the current node will be reset to the adaptive position. After the user saves the current data, the adaptive position can be directly restored.
VEditor's minimap uses canvg rendering, which directly converts SVG to Canvas, which can ensure the accuracy of the minimap and reduce performance loss. In terms of interaction, it provides a full set of view changing and dragging functions.
Future plan
In the future planning, VEditor is more inclined to be an open-ended graph data editor and renderer. While completely missing functions, it will expand the scenes that graph editing can play and maintain ease of use.
- Add box selector and multi-select actions
- Undirected graph, double arrow support
- Further optimization of performance
👉 GitHub open source address: https://github.com/vesoft-inc/nebulagraph-veditor
Welcome to give us suggestions and contribute PR~
Exchange graph database technology? To join the NebulaGraph exchange group, please fill in your NebulaGraph business card first, and the Nebula assistant will pull you into the group~~


**粗体** _斜体_ [链接](http://example.com) `代码` - 列表 > 引用。你还可以使用@来通知其他用户。