Are you still "inner cow full face" for the full screen formula? Are you still worrying about the parsing of long strings of formulas? Still troubled by locating the wrong formula? I have to write code at work, and I have to analyze this long and smelly formula when I work overtime. How is your hairline?
Ben Grape is here to save your hairline! Not a shampoo, but a formula tracker! In this chapter, let Ben Grape take you to use the front-end spreadsheet formula to trace and build a formula tree to quickly (solve) quickly (rescue) divide (you) analyze (the) public (delete) formula (issue) problems.
background
In auditing, accounting, finance and other industries that have a large demand for formulas and need to be analyzed, complex formula calculations are often encountered, and it is necessary to know whether the results of each calculation step or the data cited are correct. At this time, the full screen formula seems to tell you: Don't think about getting off work! Manually decompose the formula step by step, it is better to say if you encounter a short formula. Encountering a long formula is not only a lot of work, but also prone to errors. If you accidentally make a mistake, you will miss the last train time. So how can we quickly disassemble the formula and analyze each calculation step in it?
Here, we can use the above-mentioned calculation engine of SpreadJS to hand over the analysis to the machine. After the analysis is completed, a clear and clear formula tree can be drawn through the shape function of SpreadJS itself. Not only fast and stable, but the important thing is to get off work early, isn't he fragrant?
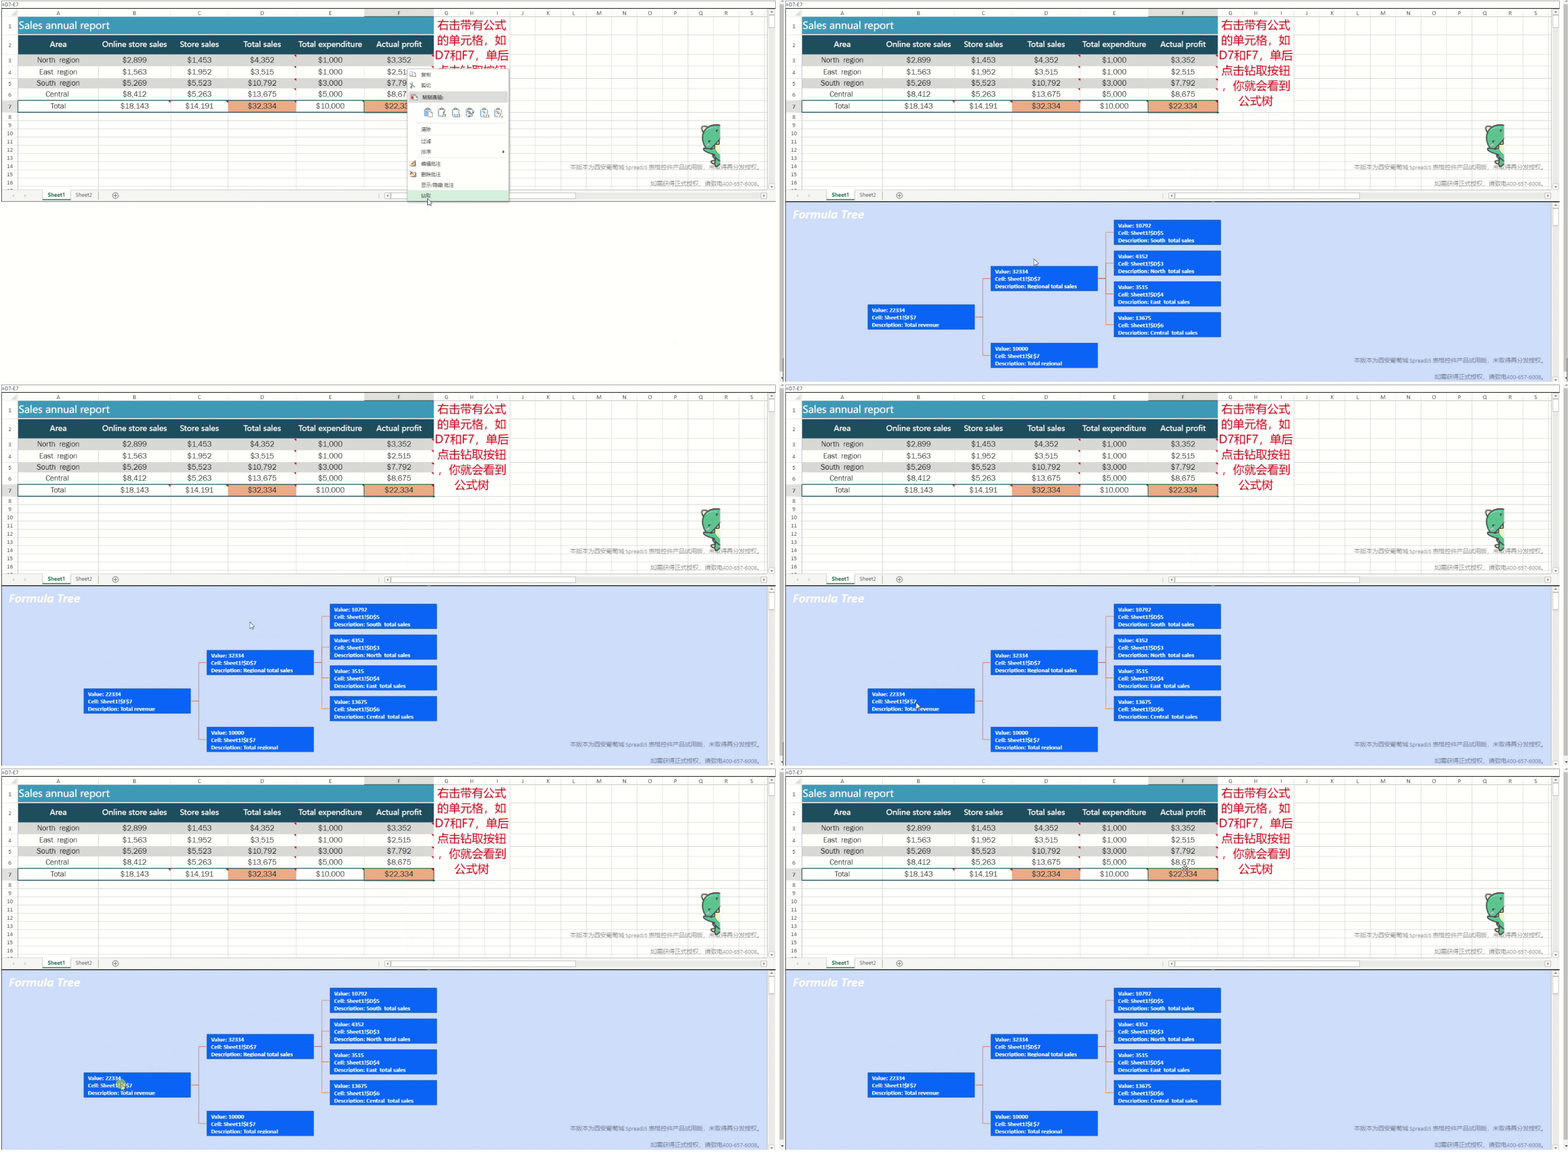
ok, then let's see the effect.
Implementation steps
In order to realize such a formula tree, the introduction of SpreadJS is an essential step. I won’t go into details on how to import it here. I will mainly talk about how this formula tree and the corresponding right-click menu are implemented. For a quick start, please refer to the link below. demo:
https://demo.grapecity.com.cn/spreadjs/SpreadJSTutorial/features/workbook/initialization/purejs
You can see that in addition to using a workbook instance to display data and formulas normally, the above image is also a workbook instance below, which is used to draw formula trees through shapes. The implementation of the formula tree can actually be more flexible. For example, a modal window pops up, a SpreadJS instance is loaded in the modal window, or it is possible to draw it entirely by itself. Because through the formula tracking of SpreadJS, you can get the reference information related to the formula. As for how to draw it, it is possible.
We can define the workbook object above as spread, and define the workbook object that draws the formula tree below as spreadForShow. By default, we hide spreadForShow through css.
We initialize two workbook instances with the following code.
In order to be able to see the formula corresponding to the cell more clearly, a formula bar is also added here to bind the Spread, and the following code can be used.
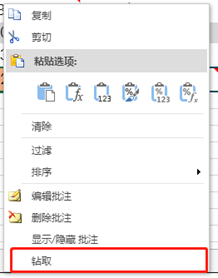
The next step is to create the corresponding right-click menu "drill" item. The following figure shows the effect of adding a right-click menu item.
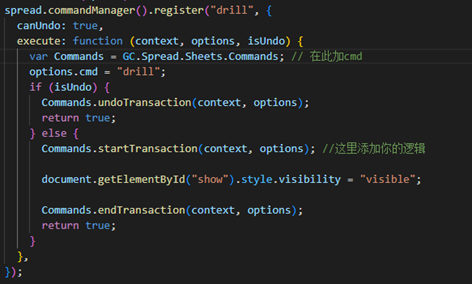
Correspondingly, we need to register the processing command after clicking this item. The core, that is, the role is mainly,
document.getElementById("show").style.visibility = "visible";
Is to control the display of the workbook spreadForShow. The rest of the code can be simply understood as a "template" for creating commands. For detailed registration commands, please refer to the following links:
https://demo.grapecity.com.cn/spreadjs/SpreadJSTutorial/features/worksheet/actions/custom-action#
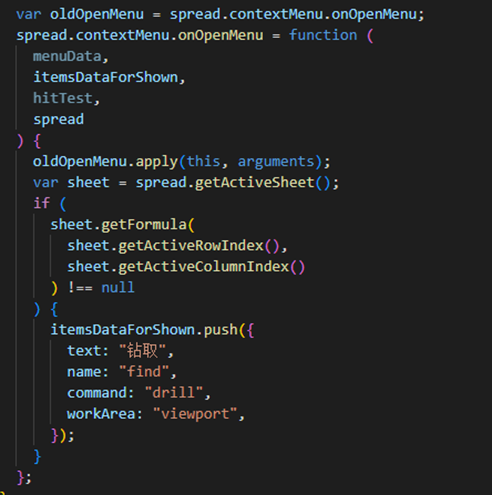
After registering the corresponding command, in order to make this item appear only in the cells of the formula, you can rewrite onOpenMenu. In this method, getFormula is used to determine whether the clicked cell has a formula. If there is a formula, add a "Drill" item to the right-click menu array.
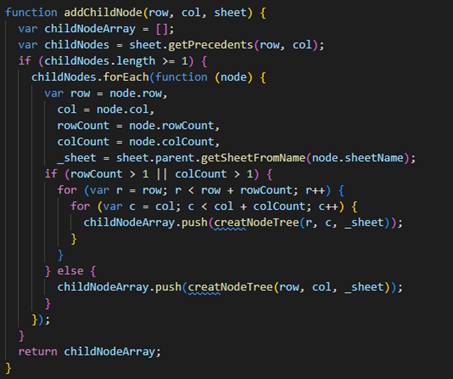
The above is some preliminary preparation code, let's take a look at how to obtain the reference information of the formula. Through sheet.getPrecedents(row, col), you can get the cell specifically referenced by the formula in the cell, and return an object array.
In order to draw the formula tree in advance when the cell is clicked, an event listener is used here. When the selection changes are monitored, the methods of creating a node and drawing the formula tree are called respectively (will be introduced later). The workbook will then be hidden with spreadForShow showing the formula tree. Because our main logic is to display the formula tree by right-clicking, and then close the formula tree when switching cells.
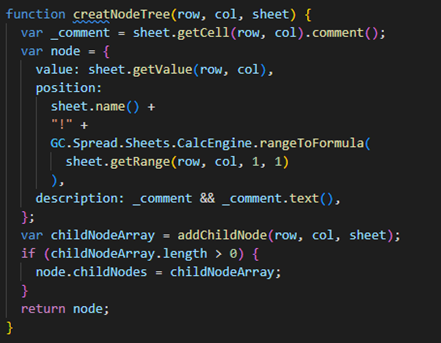
The next step is to create a node referenced by the formula. In order to display more information about the cell on the node, create a corresponding node object for each cell, including the cell value, cell location, and cell description.
The next step is to start from the original formula and find it layer by layer. Starting from the original formula cell, after finding the corresponding reference cell through sheet.getPrecedents(row, col);. Take the found cell as a starting point, and search down again until you can't find it.
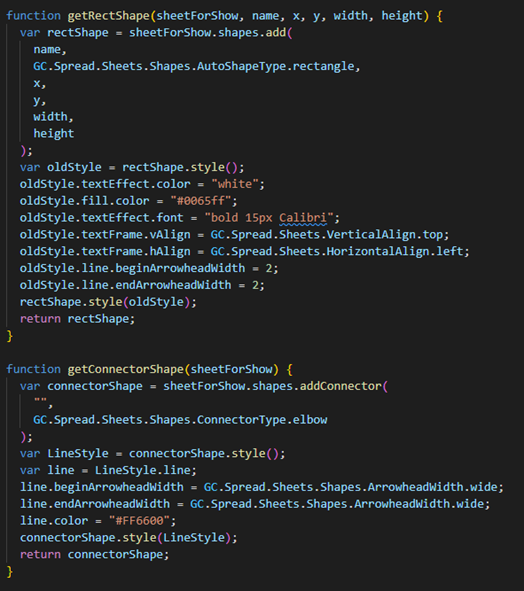
After finding the nodes corresponding to the formula one by one, you can start to draw on the spreadForShow workbook. Let's draw the rectangles that display the data and the connector shapes that connect those shapes. In the following code, getRectShape is used to create a rectangle that displays data, and the text color, fill color, font, etc. are set through the code. getConnectorShape is used to create a line connector, setting the line width, color, etc.
Finally, the formula tree is drawn according to the previously constructed nodes and the predefined shape method. In this if-else, if the node is the parent node, the child nodes are connected through the connector type, and if there is no child node, there is no need to connect. In the creatNodeTree method, the defined node information is set on the corresponding rectangle by splicing. That is, draw down one node by one until the drawing is completed.
How about it? Can you achieve the corresponding function after reading the above introduction? Want to have such powerful data at once? Technical articles without demos are just as tasteless as instant noodles without seasoning packets. Hurry up and download the demo to try it~
https://gcdn.grapecity.com.cn/forum.php?mod=attachment&aid=MjI3NTA1fGNiZTgzNTU4fDE2NjA4OTY1Njh8NjI2NzZ8OTk3MTg%3D






**粗体** _斜体_ [链接](http://example.com) `代码` - 列表 > 引用。你还可以使用@来通知其他用户。