introduction
This article mainly introduces the flame graph and its usage skills, and learns how to use the flame graph to quickly locate the performance stuck point of the software.
Combined with best practice cases, it helps readers to have a deeper understanding of the structure and principle of flame graphs, understand CPU time consumption, and locate performance bottlenecks.
background
current status
Assuming no flame graph, how did you tune your program code? Let's take a swipe.
1. Function switch method
Back then, when I was just working and I was a technical novice, I could only rely on metaphysics to troubleshoot problems. I could roughly guess that the problem might be caused by a certain function code. At this time, the troubleshooting method was to delete the redundant function code, and then run it again. Check the CPU consumption to identify the problem. (I still find some old people use this method to debug performance when I work.)
 public void demo() {

    if (关闭1) {
        // 功能1
        handle1();
    }

    if (关闭2) {
        // 功能2
        handle2();
    }

    if (打开3) {
        // 功能3
        handle3();
    }

    // 功能4
    handle4();
}
This method relies entirely on "experience" and "luck", and changes the code structure. Assuming that this is an integration area code that has passed the test, it is very dangerous to modify the code function to debug the program. Of course, there is Git The warehouse can be "one-click restore", but it is a human operation, there will always be mistakes, and the positioning efficiency is too low
2. StopWatch method
When there is a performance problem in the program, and you are not sure which piece of code is causing the time-consuming, you can use the method time-consuming to judge. At this time, we only need to append the time-consuming log before and after calling the method to determine which method is the most time-consuming. time consuming.
 public void demo() {
    Stopwatch stopwatch = Stopwatch.createStarted();
    handle1();
    log.info("method handle1 cost: {} ms",
             stopwatch.elapsed(TimeUnit.MILLISECONDS));

    handle2();
    log.info("method handle2 cost: {} ms",
             stopwatch.elapsed(TimeUnit.MILLISECONDS));

    handle3();
    log.info("method handle3 cost: {} ms",
             stopwatch.elapsed(TimeUnit.MILLISECONDS));

    handle4();
    log.info("method handle4 cost: {} ms",
             stopwatch.stop().elapsed(TimeUnit.MILLISECONDS));
}
The advantage of this method over the previous method is that, without changing the logic of the code, only some observation points are enhanced, and the performance bottleneck is located by the time-consuming method. However, assuming that the processing call stack of the method is very deep, you have to bury the point again in the sub-method. At this time, the judgment process is: bury point -> release version -> positioning -> buried point -> release version -> positioning -> ...... And in essence, the code is changed, and there is a possibility of errors. Tired and inefficient!
3. TOP command locates hot threads
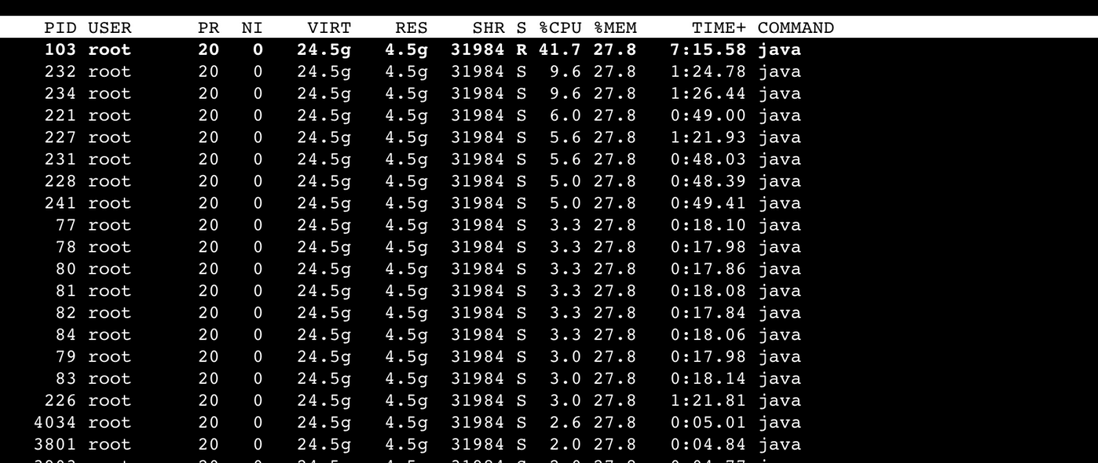
Generally, the software services of enterprises are deployed on the Linux operating system. The most convenient way for experienced veterans to check performance is top positioning.
top -p pid -H
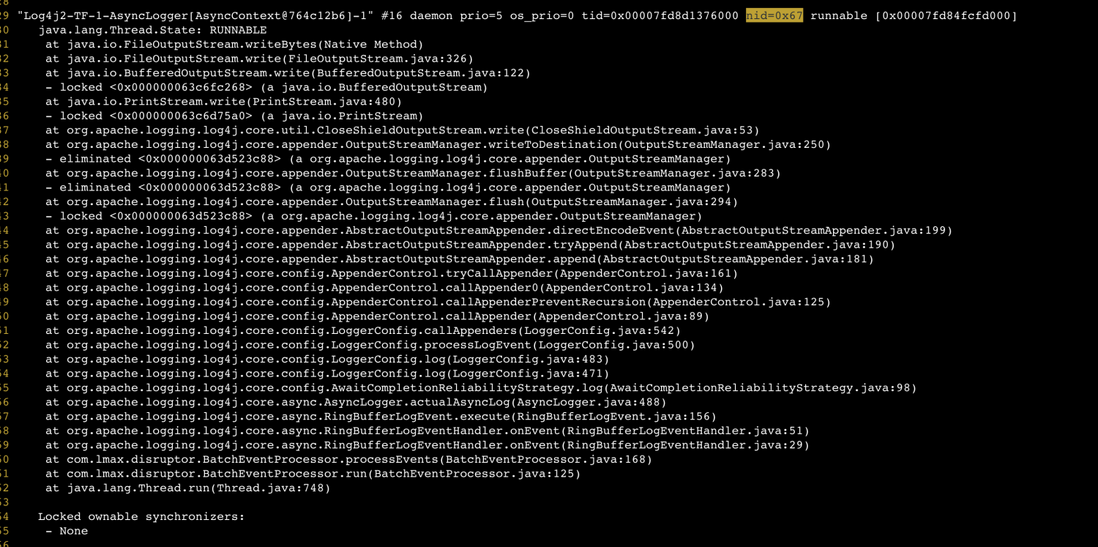
Obviously, pid 103 consumes 40% of the CPU, and find the corresponding stack thread information as follows (ignore the search method, I assume you already know:)):
At this point, it can be concluded that the current most CPU-consuming thread is writing to the disk file, and the tracing code will eventually locate it because a large number of INFO logs are logged in a high-concurrency scenario, causing disk writing to become a bottleneck.
Summary: The TOP command is very effective for finding CPU performance bottlenecks, but there are the following problems:
- Top must be the most CPU-intensive at the time, but not necessarily the cause of program performance. For example, a large number of ERROR logs are printed due to a BUG, and the final LOG to disk is the most CPU-consuming, but it is not the culprit.
- TOP is destined to make you only pay attention to the highest. After you fix the problem that consumes the most CPU, you will often encounter other program problems that cause the CPU to be high, that is, you can only see one problem at a time, and you can't see the whole picture.
- The expressiveness of text is very limited: firstly, you must be very familiar with Linux and JVM commands, and secondly, when text is used to perform correlation analysis on two or more values, it is very difficult to do so. At this time, another analysis tool is urgently needed - graph .
What is a flame graph
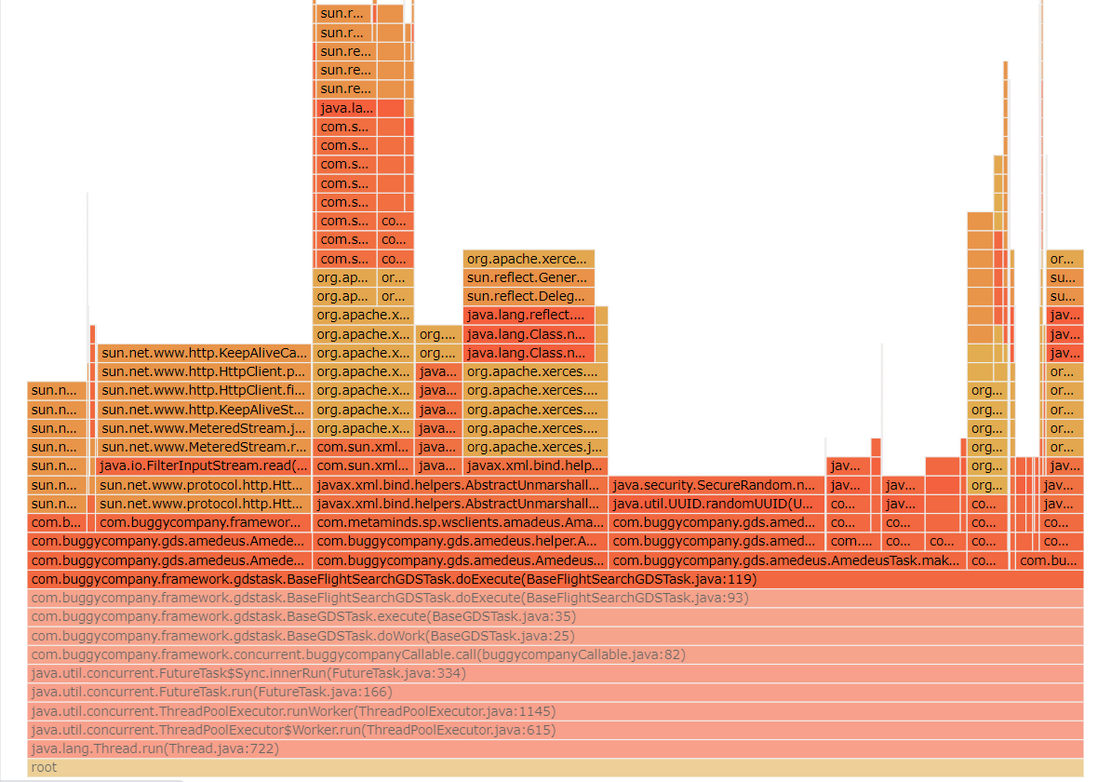
Flame Graphs ( Flame Graphs ), named for its shape like a flame.
The above is a typical flame graph. It consists of squares of various sizes/colors. Each square is also marked with text. The top of the whole picture is uneven and looks like clusters of "fires", hence the name flame graph.
The flame graph is generated by SVG, so it can be interacted with the user, and when the mouse hovers over a block, the internal text will be displayed in detail. After clicking, it will expand upwards with the currently clicked square as the bottom.
Features <br>Before using flame graph analysis, we must first understand the basic structure of the flame graph
- Each column represents a call stack, and each cell represents a called function
- The characters on the square identify the calling method, and the numbers indicate the current sampling occurrences
- The Y-axis represents the depth of the call stack, and the X-axis merges multiple call stacks and displays them in alphabetical order.
- The width of the X-axis represents the frequency of occurrence in the sampled data, that is, the larger the width, the greater the cause of the performance bottleneck may be ( note: it is possible, not certain )
Colors don't make sense, randomly assigned (maybe the founder wants you to look more like a flame..)
What a flame graph can do
At this point, you already know the flame graph, how to locate software problems? We need a methodology for finding performance bottlenecks.
It is clear that the caliber of high CPU consumptionCPU 消耗高的口径 = 调用栈出现频率最高的一定是吃 CPU 的
As above, we already know the structure of the flame graph and the meaning of "material". At this time, our focus should be on the width of the square. The width of the square represents the number of times the call stack appears in the entire sampling history. The number of times means the frequency, that is, the more times it occurs, the more CPU is likely to be consumed.
But it is useless to only focus on the longest one. For example, the root at the bottom and the square in the middle are very wide. It can only show that these methods are "entry methods", that is, methods that will be passed through each time a call is made.
We should pay more attention to the high number of " plateaus " at the top of the Flaming Mountain , that is, there are no sub-calls , and the sampling frequency is high, indicating that the execution time of the method is long, or the execution frequency is too high (such as long polling), That is, most of the execution of the CPU is allocated to "Pingdingshan", which is the root cause of the performance bottleneck.
Summarize the methodology: The flame graph looks at the "flat top mountain", and the function on the top of the mountain may have performance problems!
Best Practices
Practice is the only criterion for testing truth! Below I will use a small Demo to show how to locate program performance problems and deepen the understanding of the use of flame graphs.
The demo program is as follows:
 public class Demo {

    public static void main(String[] args) throws InterruptedException {
        ExecutorService executorService = Executors.newFixedThreadPool(20);

        while (true) {
            executorService.submit(Demo::handle1);
            executorService.submit(Demo::handle2);
            executorService.submit(Demo::handle3);
            executorService.submit(Demo::handle4);
        }
    }

    @SneakyThrows
    private static void handle4() {
        Thread.sleep(1000);
    }

    @SneakyThrows
    private static void handle2() {
        Thread.sleep(50);
    }

    @SneakyThrows
    private static void handle3() {
        Thread.sleep(100);
    }

    @SneakyThrows
    private static void handle1() {
        Thread.sleep(50);
    }
}
The code is very simple, of course, it is not written like this in reality, mainly to cooperate with the performance. .
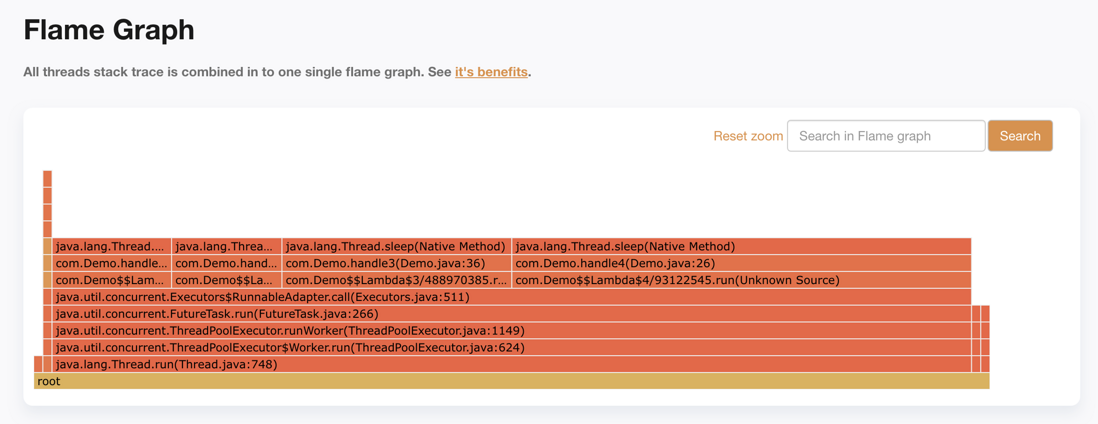
The main thing is to open a thread pool and execute four tasks respectively. Different tasks take different time. At this time, our performance bottleneck is the task of handle4. Under the premise of knowing the conclusion, we compare the flame graph to get the answer. Does it meet expectations!
1. JVM stack information pull
Currently, I am running a program on my own Mac. It is very convenient for idea to execute this program. How to get the PID of the currently running main function?
At this time, you need to use the TOP command. The above is a while loop. It is obvious that the CPU is the most powerful. As long as you find the highest PID belonging to the Java thread, you are required.
Obviously get COMMAND=java highest PID=20552
At this point, execute the following command to obtain stack information and write it to the tmp.txt file
jstack -l 20552 > tmp.txt2. Generate a flame graph
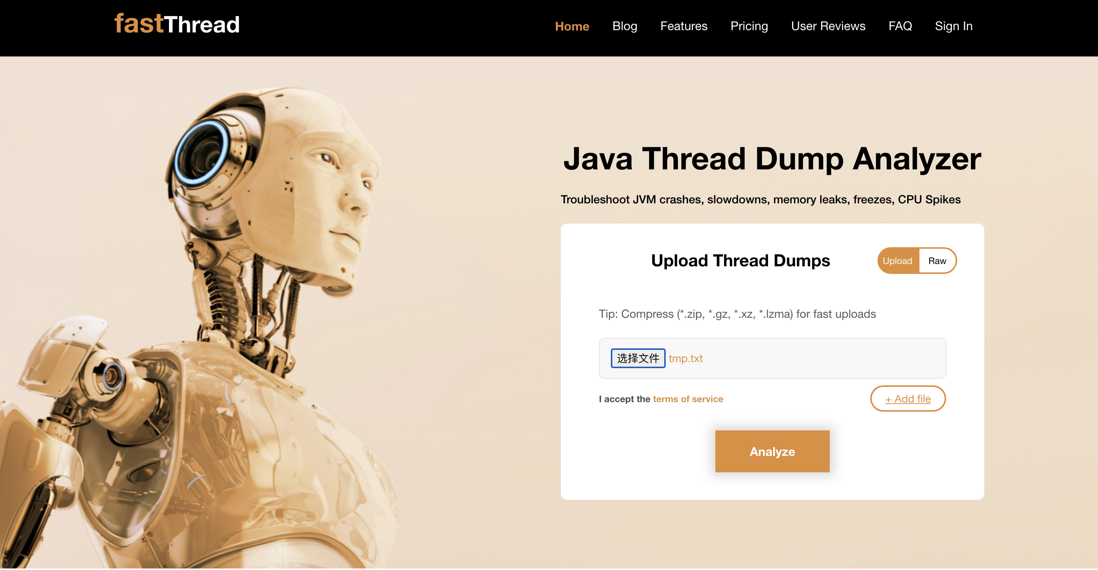
There are many tools for generating flame graphs. I usually use FastThread to analyze the stack online, which is very convenient. At the same time, it supports generating flame graphs, which is convenient for us to locate problems.
Open the homepage of the official website, select the stack file just dumped, and click Analyze. At this time, you only need to wait for the website to be analyzed (normally 3~5 s), and then you can view the flame graph
The fastThread website analysis report is very rich. For general problems, we can basically locate the problem through the conclusions it gives. This article does not need to be concerned for the time being. If you are interested, I will share it later and pull it directly to the subtitle of Flame Graph.
At this point, 4 "flat tops" can be clearly seen, and the width of com.Demo.handle4 is the largest, followed by com.Demo.handle3, which is in line with expectations!
Principle analysis
Based on the above small Demo, we have a deep understanding of the generation principle of the flame graph.
For example, to make it easier for you to understand, suppose we want to observe what a person is busy with and what is taking up the most of his time. What would we do?
From the perspective of time, and regardless of cost, I will definitely arrange a surveillance camera to monitor him 24 hours a day and 360 degrees, and then arrange personnel to check frame by frame, and summarize what he has done, and come to the conclusion: sleep 8 hours, work 8h, 4h for mobile phone play, 2h for eating, and 2h for other. It was concluded that sleeping took up the most of his time.
A set of analysis procedures can be summarized from the above:
记录(监控)-> 分析&归并(逐帧排查) -> Top N -> 得出结论 Taking the process to see how we should check the CPU execution, which things (processes/threads) take up the most of its time?
The simple and rude method is to record the executed method stack at every moment, and then summarize and merge to find out where the most time-consuming method stack is. The problem with this method is that
- Big amount of data
- long time
In fact, it is good to just sample to observe what the CPU is doing. This is a probabilistic problem. If the CPU is time-consuming to execute a certain method, it will be sampled with a high probability, and the merged results will be the most. Although there are errors, many statistics Next, not much.
In the same way, dump the stack under the stack to see what most threads are doing. According to the frequency of each method in the stack, the most frequent method is the method that is currently allocated and executed by the current CPU.
 "pool-1-thread-18" #28 prio=5 os_prio=31 tid=0x00007f9a8d4c0000 nid=0x8d03 sleeping[0x000000030be59000]
    java.lang.Thread.State: TIMED_WAITING (sleeping)
    at java.lang.Thread.sleep(Native Method)
    at com.Demo.handle2(Demo.java:31)
    at com.Demo$$Lambda$2/1277181601.run(Unknown Source)
    at java.util.concurrent.Executors$RunnableAdapter.call(Executors.java:511)
    at java.util.concurrent.FutureTask.run(FutureTask.java:266)
    at java.util.concurrent.ThreadPoolExecutor.runWorker(ThreadPoolExecutor.java:1149)
    at java.util.concurrent.ThreadPoolExecutor$Worker.run(ThreadPoolExecutor.java:624)
    at java.lang.Thread.run(Thread.java:748)

    Locked ownable synchronizers:
- <0x00000006c6921ac0> (a java.util.concurrent.ThreadPoolExecutor$Worker)
As for how our jstack information is processed into flame graph format, the community has provided tools for common dump formats, stackcollapse-jstack.pl to handle jstack output.
 Example input:

"MyProg" #273 daemon prio=9 os_prio=0 tid=0x00007f273c038800 nid=0xe3c runnable [0x00007f28a30f2000]
    java.lang.Thread.State: RUNNABLE
        at java.net.SocketInputStream.socketRead0(Native Method)
        at java.net.SocketInputStream.read(SocketInputStream.java:121)
        ...
        at java.lang.Thread.run(Thread.java:744)

Example output:

MyProg;java.lang.Thread.run;java.net.SocketInputStream.read;java.net.SocketInputStream.socketRead0 1
Summary & Outlook
This concludes the introduction of flame graphs. I believe you have another way to troubleshoot problems!
Existence is reasonable. Needless to say, in terms of the importance of tool development, I always have an inclusive attitude towards new things. It really solves some pain points and stands out.
I will introduce more troubleshooting methods in the future. If you like the style of this article, please pay attention or leave a message, welcome to discuss!
Welcome to the official account: Gugu Chicken Technical Column Personal technical blog: https://jifuwei.github.io/




**粗体** _斜体_ [链接](http://example.com) `代码` - 列表 > 引用。你还可以使用@来通知其他用户。