
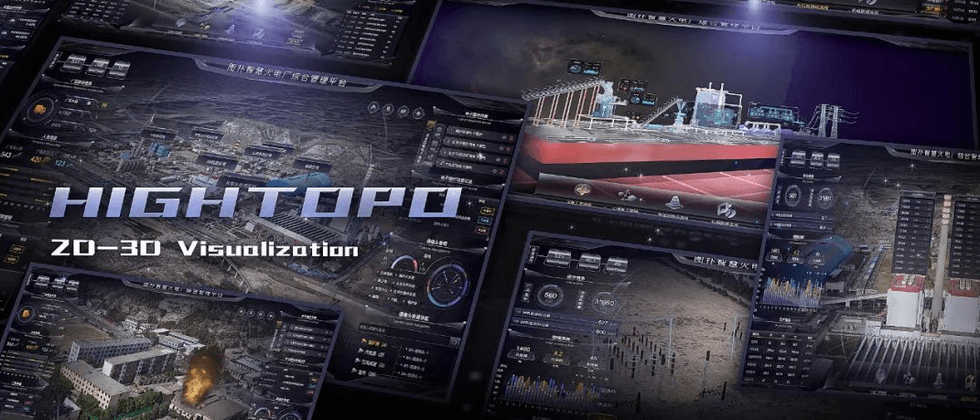
foreword
In July, the daily maximum temperature of 245 national meteorological stations exceeded the historical extreme value of July; at the same time, the situation of epidemic prevention and control was improving, enterprises accelerated the pace of resumption of work and production, and the power load repeatedly hit new highs. Coal power, as the main power source in my country, uses less than 50% of the installed capacity, produces about 60% of the country's electricity, and meets over 70% of the peak load demand.
As a kind of thermal power generation, coal power converts the power plant into electrical energy through the thermal energy generated when coal is burned. Using the 2D, 3D and GIS visualization technology of Tupu software combined with oblique photography and digital twin technology, the construction of different unit areas, coal handling areas, chemical water treatment areas, public system areas, living and office areas, main transformers and booster stations of thermal power plants 3D visualization system for areas. Utilizing ubiquitous perception, self-adaptation, intelligent integration and interaction, thermal power plants can realize intelligent management in different links such as engineering design, production scheduling, process monitoring, fault diagnosis, operation management and control, and visual operation and maintenance.

HT for Web GIS supports the loading of different map tile services or data, 3DTiles format data of aerial oblique photography real scenes, and different GIS data such as urban buildings. Seamless integration and other technical advantages, in the GIS system, the massive POI data, traffic flow data, planning data, status data, etc. are displayed in a variety of ways.

The smart thermal power plant based on HT for Web and GIS technology realizes the digital twin of thermal power plant by acquiring 3D scene data. Based on the three-dimensional technology of digital twin, integrate new ICT technologies such as the Internet of Things, artificial intelligence, big data, etc., and carry out all-round digital construction of thermal power plant safety modules, environmental protection modules, and production modules, and build a new generation of technology, high efficiency, and safety. , green and healthy thermal power plants. Perform meteorological simulation based on weather data, and show the three-dimensional simulation effect of different meteorological data such as rain and snow according to specific needs. Meteorological data can also be accessed to take countermeasures before severe weather arrives.

There are two main ways to obtain 3D scene data of thermal power plants: aerial photography modeling and artificial modeling.
Aerial photography modeling, also known as oblique photography real 3D. Through synchronous acquisition of images from one vertical, four oblique, and five different viewing angles, complex scenes are comprehensively perceived in a large-scale, high-precision, high-definition manner, and rich high-resolution textures of the top and side views of buildings are obtained. . It can not only truly reflect the ground object information, but also generate a three-dimensional plant model with geographic coordinate system information through technologies such as positioning, fusion, and modeling. Aerial photography modeling can be accurately matched with GIS. OSGB model data has multiple levels of detail (LOD), and the system can display LOD level models with different precisions according to the user’s browsing and the distance to the scene.

Manual modeling, using modeling software such as 3dsMax, Maya, C4D, etc., based on image data, CAD plan or photographed pictures to estimate the outline and height of buildings and other information for manual modeling. However, the architectural texture deviates greatly from the actual effect, and the production process also requires a lot of manual participation; the data production cycle is long and the timeliness is low. To match manual modeling with GIS, manual spatial correction and registration is required.
Click to see the difference between aerial photography VS artificial modeling
 性能上,倾斜摄影适用于大面积复杂厂区或建筑群,可快速通过航拍采集的数据生成场景,避免花费大量时间进行手工建模。通过层级方式加载,不受性能限制,可以承载人工建模所无法承载的场景规模。


效果上,倾斜摄影所见即所得,可展示所有拍摄到的物体,但效果上不如人工建模,拉近后会存在模型贴图模糊,模型细节丢失等问题。同时倾斜摄影的灵活性也不如人工建模,如需对单栋模型实现点击事件,还需要进行单体化处理,并且无法从模型层面实现一些动画效果,例如拆解、透视、零部件拆解动作等。


成本上,航拍大规模成图加上从倾斜影像批量提取及贴纹理的方式,能够有效的降低三维建模成本,提升模型的生产效率,降低了三维模型数据采集的经济代价。


工期上,通常 1-5 平方公里面积,采集数据+生成模型在 1-2 周左右,人工建模则是取决于建筑/设备数量和复杂程度,通常单个厂区建模周期在 1-4 个月之间。 
In practical applications, users can choose an appropriate method according to their own needs, or they can be implemented by combining the two. For example, in this case, the three methods of oblique photography + artificial modeling + BIM model are superimposed to display the thermal power plant in an all-round way.
Show results
perspective effect
By means of manual modeling, using the virtual simulation technology of Tupu software, according to the internal layout of the smart thermal power plant unit area, a 1:1 3D visual simulation interactive model is produced, and the internal equipment and buildings can be seen at a glance, which is convenient for operation and maintenance.

For smart thermal power plants, simulation modeling display is far from meeting the needs. Using Tupu software combined with GIS for positioning, monitoring and management of personnel, vehicles and equipment, analyzing the rationality of the deployment and control of various monitoring points, and comprehensively monitoring the production status of the factory area are the key points of the intelligent transformation of the factory area. In terms of safety, digital twinning is carried out on the plant area and fire-fighting equipment; in terms of environmental protection, the emission of toxic and harmful substances such as NO2, mercury and PM2.5 is analyzed to guide the environmental governance of thermal power plants and promote the green transformation of the plant area.
Roaming inspection
Power inspectors in thermal power plants need to conduct standardized inspections of operating machines, process equipment, pipelines, instrumentation, etc., to discover and professionally identify hidden dangers, deal with hidden dangers, and report hidden dangers, so that equipment failures disappear in the bud. Through the process of patrolling the simulated person or the patrol vehicle, you can stop to view the device information when passing by the device. Roaming inspection function According to the added multi-type inspection content and multiple inspection paths, the first-person perspective roaming or drone perspective roaming can be used for full-time automatic inspection, and the inspection speed can be freely selected.

The first-person walkthrough provides an immersive experience. Drone perspective roaming and viewing from the air, showing the grandeur of the thermal power plant, bringing a shocking look and feel. Meet the operation and maintenance management characteristics of different types of assets.
security module
Safety management is the foundation for the smooth and normal operation of an enterprise. Using cloud computing, big data, virtual simulation, Beidou positioning and other technologies to improve safety management level and improve safety management efficiency is the management focus of modern power plants. By displaying various icons on the map corresponding to the person or object bound to the tag, the tag is monitored in real time, and the current location of the tag is displayed on the map for real-time control.

On the 2D panel of the Tupu software, the accumulated safe running time and comprehensive information of the plant area, such as fire monitoring points, access control points, plant personnel, plant vehicles, electronic fences, and camera information are displayed. Click the fire monitoring points in the bottom menu to view the distribution of fire monitoring points in the entire thermal power plant. Combined with systems such as Beidou and UWB, the fire point can be accurately located and the rescue time can be effectively shortened.
fire rehearsal
The escape route is marked with a dynamic arrow pointing to the direction of the escape exit, which can simulate multiple evacuation routes and predict the time to calculate the best escape route.

The thermal power plant has a high density of people and complex terrain, so evacuation is difficult. However, the length of evacuation time is directly related to the safety of personnel. By combining HT for Web and BIM, with the help of sensing equipment and radio frequency identification technology to determine the escape data of personnel, the real evacuation environment and evacuation situation are carried out with the three-dimensional visualization features of Hightopo. The restoration is highly in line with the real situation of the factory. Therefore, in the fire escape, it can effectively improve the escape efficiency of employees.
Personnel management
The total number of people in the plant is managed by Tupu visualization, and the personnel information of steam turbine, coal handling, and boiler room is separately counted, and personnel are quickly located through the personnel quick navigation function in the 3D scene. Personnel positioning helps managers mobilize employees in various regions, strengthen overall management, and improve the intelligence level and operational efficiency of the enterprise.

Based on the UWB positioning base station or other positioning hardware foundation, the real-time positioning visualization function of employees in the factory can be realized in the three-dimensional scene. The Tupu software visualization management system is deployed in the centralized control center, and managers can monitor the positions of on-duty personnel in the factory in real time, and view employee information, action trajectories and other data through scene interaction. Employees can carry the positioning card device with them, and in case of danger, they can manually send out SOS information. The operation and maintenance of the centralized control center can respond immediately when they see the distress information in the Tupu software visualization system.
access control
Access control security management integrates Tupu visualization technology, AI face recognition technology, computer automatic identification technology, and modern security management measures. It involves many new technologies such as electronics, machinery, optics, computer technology, communication technology, and biotechnology. It can effectively Identify and record pedestrian and vehicle information. On the large visual screen of Tupu, you can view the distribution area of the access control, the number of people passing through the access control on the day, the number of people intercepted, and the reasons for the interception, build a grid social security prevention and control system, and improve the prevention and emergency handling capabilities of various accidents, cases and emergencies .

The access control system can also be integrated with other professional systems such as building automation, closed-circuit monitoring, anti-theft and fire alarm systems, so as to improve the integrity and safety of security, such as:
Camera management
Cameras are the key to active defense in the factory area. The list displays the number of online and offline cameras, and you can search and view camera locations by name. The Tupu software query interface adopts the event mechanism to update the interface locally, avoiding the FPS game mode, excessively meaningless interface refreshes, and avoiding problems such as desktop freezes and mobile phone hot.
Click the camera icon at the bottom of the 3D scene to view the distribution of smart cameras in the factory area. The AI algorithm is superimposed on the camera to recognize the behavior of people and objects, so that ordinary cameras can think. The visual interface is connected to the monitoring system to display the current factory scene.

As a component library based on HTML5 standard, Tupu software product HT for Web can seamlessly integrate various multimedia functions of HTML5, supports the integration of various video resources to form a unified video stream, and can mark and associate camera objects on 2D and 3D situation maps. Its video signal source can retrieve the corresponding surveillance video through scene interaction to meet the monitoring needs of operation and maintenance personnel for real-time situational awareness of the scene, retrospective comparison of historical data, and emergency response plans.
Tupu software also supports video fusion, which fuses 2D video images into the 3D model of the scene, providing users with intuitive video images and simple view control. Through the superimposed display of indoor surveillance video and 3D scenes, you can view the scene as if you were there. It can also realize advanced functions such as automatic video inspection of critical paths and fast target locking in key areas, providing intuitive and accurate assistance for daily management and emergency handling.
electric fence
In the 3D interface of the thermal power plant, the position of each electronic fence in the plant area is indicated by yellow, and a prompt box will pop up when personnel invade, reminding the operation and maintenance of the centralized control center to notify the intruder to leave in time. Use the 2D panel of Tupu software to display violation records, such as violation time, event, and processing status, and then strengthen management in a targeted manner. Click the small eye behind the electronic fence in the panel to zoom in the camera, or manually draw the electronic fence area as needed.

Electronic fence is a relatively advanced perimeter protection and alarm system at present. It adopts the advanced perimeter security concept of "blocking as the mainstay, and alarming as the auxiliary". Conduct analysis and judgment. Fences are divided into permanent fences and temporary fences. Permanent fences appear in steam turbines, transformers, booster stations and other areas in thermal power plant projects; temporary fences appear in temporary construction or "two votes" maintenance areas in the factory.

vehicle management
As a dense multi-path site, thermal power plants can use UWB, Wi-Fi, Bluetooth, infrared, ultra-wideband, RFID, ZigBee, motion capture, ultrasonic and other technologies to cooperate with the Beidou satellite navigation system to collect vehicle trajectories. Combining the Tupu visualization system with the road network system can achieve the purpose of shortening the travel time of vehicles, reducing driving delays, reducing empty driving and random parking of vehicles, ensuring driving safety, and improving the road traffic capacity in the field.

The vehicle positioning management and control system in the factory area has functions such as vehicle basic information query, vehicle real-time positioning and tracking, vehicle real-time location search, vehicle safety status query, vehicle real-time inspection and inventory, vehicle abnormal alarm linkage and other functions, which can realize real-time vehicle monitoring and intelligent safety warning in the factory. , improve the efficiency of intelligent vehicle management.

If the vehicle fails within the positioning range, the alarm information can be sent to the ground dispatching room in time through the alarm button; according to the actual situation, the location and action track route can be predicted and determined.
Safety four color map
Combined with the actual situation of the thermal power plant itself, the enterprise security risk distribution map is drawn, and targeted management and control measures are taken for different levels of security risks from the aspects of organization, system, technology, emergency, etc., to ensure that the security risks are always within the control range. In the digital twin of Tupu software, the safety risk level of thermal power plants is divided into major risks, major risks, general risks and low risks from high to low, which are marked with four colors of red, orange, yellow and blue respectively. Through the analysis of the four-color map of plant safety, it has important guiding significance for the deployment and control of fire-fighting equipment and monitoring equipment in key safety-prevention areas.

Environmental protection module
The environmental pollution caused by thermal power plants mainly includes air pollution, waste water pollution, industrial solid waste pollution, industrial noise pollution, and electromagnetic pollution. The flue gas of the boiler is discharged into the atmosphere through the high chimney, and the smoke, NO2, mercury emissions, PM10, PM2.5, SO2 normal and abnormal index data of the monitoring points are counted through the Tupu visualization system, and the environmental management of the abnormal index area is strengthened. Green factory.

Tupu software uses graphical means to interpret and convey data information clearly and effectively, and uses bar charts, area charts, line charts, etc. to count monthly NO2, PM10, PM2.5, and SO2 emissions to help us discover which The laws and characteristics of the data, mining the value behind the data. Through the functions of data transfer, conversion, purification, and integration between various data sources, unified storage and unified display of environmental data are realized.
Click each type of emissions in the bottom menu, and icons will appear in the corresponding distribution area in the 3D scene. Double-click the corresponding small icon in the 3D scene to pop up a 2D panel to view the hourly changes of various toxic and hazardous substances. Through the sorting and refining of the data level, the effective information resources scattered in each "information island" will be fully integrated to fully support data sharing, unified management and analysis and decision-making.

AQI cloud map
Use green, yellow, orange, red and purple to indicate the severity of air pollution, strengthen environmental management and personnel access in heavily polluted areas, and ensure the health of employees.

Through the cross-platform standard data protocol, the valuable data in each independent and decentralized database or information system is extracted to the Tupu visualization system to realize multi-service processing and data sharing at the management and decision-making level.
production module
The principle of thermal power generation is to heat water to generate steam during combustion, and convert the chemical energy of the fuel into thermal energy. Tupu software uses lightweight 3D modeling technology to digitally twin the power generation process of thermal power plants, bringing an immersive look and feel.

3D process flow
The three-dimensional configuration is used to realize the equipment connection in the key process flow of the power plant. On the one hand, the operation information of important equipment can be monitored; Coal machine→coal crusher→coal conveyor belt→coal feeder→coal mill→boiler→steam turbine→generator→main transformer→booster station→power grid...

Compared with traditional configuration software such as InTouch/IFix/WinCC, Tupu's web-based platform is more suitable for the general trend of C/S to B/S transformation, supports fast data binding, and rich visualization components can be used for rapid creation and deployment. Compared with the traditional interface, Tupu satisfies the modern, high-performance, cross-platform (desktop Mouse / mobile Touch / virtual reality VR) graphic display effect and interactive experience of the Industrial Internet of Things.
Equipment warning
The first-, second-, and third-level equipment warning information can be displayed in a list, which can be viewed by category to prevent the risk of explosion, overturning, and retention caused by the high-temperature exposure of the equipment. Compared with manual early warning, through the Tupu visualization platform for early warning, the process is simplified, and once the monitoring data triggers the set early warning indicators, the operation and maintenance of the centralized control center can receive early warning prompts in real time, so as to gain valuable time for the transfer of personnel from dangerous areas. At the same time, strengthen the operation management of in-service units, reduce unplanned shutdowns and blockages, and ensure stable and full output of units.

In high temperature weather, the "temperature sensor + Zigbee" temperature monitoring system can be used to accurately collect temperature signals of key equipment and key parts of the equipment, and connect to the optical fiber network through the intelligent gateway to realize network and data sharing. Through the wireless temperature measurement monitoring system in the control center, over-temperature parts and equipment can be accurately positioned, and over-temperature alarms can be ensured to ensure the life of key equipment and production continuity, and reduce and avoid the risk of potential accidents.
underground pipe network
The perspective effect is used to present the distribution of the three-dimensional underground pipe network of the thermal power plant in the plant area, to understand the layout and direction of the pipes, and to avoid damage to the pipes during underground operations. Combine various information sensors, radio frequency identification technology, infrared sensors, laser scanners, etc. to monitor the health of the pipeline to avoid the occurrence of pipe bursts and pipe cracks.

Booster station construction process
Tupu software supports overlaying BIM building data into 3D scenes, and also supports overlaying BIM models into map scenes to realize the combined display of BIM + GIS. Apply BIM technology to the construction of booster station, covering: planning, design, construction and operation and maintenance management and other stages. Combined with BIM technology, the building structure of the booster station and the equipment in the infrastructure system are simulated and presented in 3D, which is intuitive and realistic.

Rendering through the HT engine, the construction process of the booster station is simulated and restored: foundation building→enclosure→transformer area→knife gate area→switch area→steel tower→cable to realize intelligent construction control. You can choose different playback speeds such as normal speed, 2x speed, and 4x speed according to your needs to view the construction process and find unreasonable links. Combined with Tupu software, it can also realize the monitoring, measurement, control and adjustment of the operating conditions of primary equipment (transformers, circuit breakers, isolating switches and other equipment directly used to produce and use electrical energy).

Tupu software also provides the function of converting BIM models to HT primitives, which can perform lightweight processing on BIM files to ensure efficient and smooth loading and running of scenes in the Web and reduce development costs.
Unit data monitoring
Click on the unit data monitoring in the bottom menu to view the real-time data of the unit's main parameters such as unit load, turbine speed, feedwater flow, etc. in the 3D scene, and perform state maintenance of power equipment, intelligent operation of plants and stations, replacement of working robots, and big data-assisted decision-making, etc. , carry out digital and unmanned management of thermal power plants.

Tupu software seamlessly integrates 2D and 3D. Through the data binding of charts, it uses different styles of chart statistics to count safe operation days, plant area, total installed capacity, real-time power of units; daily power generation, monthly power generation, total power generation Power generation data; production indicators such as coal power supply, coal consumption for power generation, load rate, etc.; operating efficiency of equipment such as boiler units and steam turbine generator units. The combination of bar chart and line chart is used to display daily coal consumption, monthly coal consumption, and total coal consumption, so as to understand the basic operation status of the plant, and ensure the safety, economy and power quality of thermal power plant operation.
Summarize
The intelligent upgrade of thermal power plant equipment, facilities and technological processes has improved the flexible perception and efficient production and operation capabilities of the power system. However, to realize peak shaving and valley filling of the power system through thermal power plants and meet 5% of the peak load requires an investment of 400 billion yuan, while through virtual power plants, investment in construction, operation, incentives and other links is only 50-60 billion yuan.

The virtual power plant is an important tool to meet the demand-side interactive response capability of the new power system. The mode of integration of the new energy power provided by it with the traditional energy and energy storage devices can present stable power output characteristics to the large power grid. The peak power generation potential of various types of power sources has been tapped, and the start-up backup, peak shifting support, and surplus-deficiency adjustment between cross-regional power grids have been optimized.
The trend of decentralization, flattening and decentralization of the new energy system is becoming more and more obvious. Distributed energy is developing rapidly. The system model is gradually changing from the large base and large network to the parallel with microgrid and smart microgrid, which promotes the utilization efficiency of new energy. Lifting and economic costs fall.

The "China Electric Power Development Report 2022" proposes to promote the development of new energy bases through multi-energy complementary forms, and to explore the establishment of new models for effective supply and effective replacement of new energy bases. Promote the application of technologies such as multi-time-scale power prediction and intelligent regulation to effectively improve the reliable support capability and consumption level of new energy. In the first half of 2022, the power generation of clean energy such as hydropower, nuclear power, wind power and solar power exceeded 1.2 trillion kWh.
The smart grid requires the construction of an intelligent dispatching system, the realization of multi-energy synergy and complementation such as the interaction of source, network, load and storage, integration of wind and solar energy, and intelligent regulation of energy demand, and the rational layout of "new energy + energy storage" integrated friendly new energy power stations.
For more industry application examples, please refer to the case link on the official website of Tupu Software: Tupu Software - Everything you need to build advanced 2D and 3D visualization


**粗体** _斜体_ [链接](http://example.com) `代码` - 列表 > 引用。你还可以使用@来通知其他用户。