Foreword:
The resultant was pressure-tested in a separate environment by 1:1 reduction before pressure-testing in the production environment. In addition to the lack of simulation, this stress testing solution is also an independent set of services including data storage. In order to reduce the cost of stress testing and ensure the high simulation degree of stress testing, we adopted the solution of stress testing in a full-link production environment.
One of the core issues of full-link stress testing is to solve the problem of data isolation. The flow of pressure measurement cannot pollute online data. We developed the fusion scaffolding through the middleware platform, which transparently transmits pressure measurement targets in RPC, Redis, DB, MQ, and cross-threading. If it is pressure measurement traffic, the generated data will be written into the shadow library, which can be supported at the middleware level. Basic capabilities for full-link stress testing.
We used an open source stress testing platform before. However, after several years of use, we found that the maintenance cost of this platform is relatively high, and the architecture design is not suitable for the infrastructure of the product. Therefore, we have developed a new pressure measurement platform (two-open JMeter) of Dewu, and it has well supported the large-scale pressure measurement. The self-developed platform supports multiple protocols such as Dubbo, HTTP, GRPC, Websocket, Java, etc. It can also support a variety of pressure methods, such as specifying QPS/TPS, specifying the number of threads, and so on. After the stress test is completed, a comprehensive stress test report can be automatically generated to assist in analysis and troubleshooting. The bottom layer of the pressure measurement platform completely uses the infrastructure of Dewu, and the presses used in the pressure measurement platform are all containerized, which makes the pressure generation more stable and the cost is lower. Through the self-built pressure measurement platform, the support capability of the full-link pressure measurement at the platform level is realized.
Here we will focus on why we need to support the fixed QPS mode stress test. With the development of the company's business, there are higher requirements and challenges for online stability. The touch on the top is undoubtedly walking on thin ice. Therefore, blindly performing stress testing according to the number of concurrent transactions is likely to cause online failures. It can control the flow of pressure testing and is very accurate. Combined with the pressure testing of the QPS/TPS target values given by each domain, the large number of large It shortens the preparation time and reduces the manpower investment year by year, which also reduces the stability problems caused by stress testing.
1. Introduction to the functions of the pressure measurement platform
The pressure measurement platform is built to reduce the maintenance cost of the pressure measurement platform, improve the efficiency of the pressure measurement process, improve the ease of use and experience of the pressure measurement, and ensure the stability during the pressure measurement. In the face of today's high-traffic era, it is undoubtedly not a tool to find out the bottleneck of application performance, but also a technical guarantee.
The new pressure measurement platform uses the JMeter engine, and the core features are as follows:
- Supports high concurrent stress testing on the entire link
- Supports multi-protocol HTTP, Dubbo, Websocket, GRPC, JDBC, Java
- Support multiple pressure measurement modes, concurrent mode, throughput mode
- Support internal and external network, full Netcom access stress test
- Support online script pressure configuration linkage change
- Support a variety of resource pool modes, dynamic resource pool is the application of the dynamic container of the press, the efficient resource utilization mode of instant start, instant release, and fixed resource pool mode
- Support no main pressure mode, efficient pressure generation to break the bottleneck of the main control machine
- Support pressure tester self-monitoring
- Support automatic generation of comprehensive stress test report data and stress test QPS & response time curve
- Support scheduled task automation script execution
Single pen debugging function
2. Architecture design of stress testing platform
Comparison of the overall architecture and the old version of the open source stress testing platform:
3. The core stress testing logic of the stress testing platform
3.1 Pressure Process
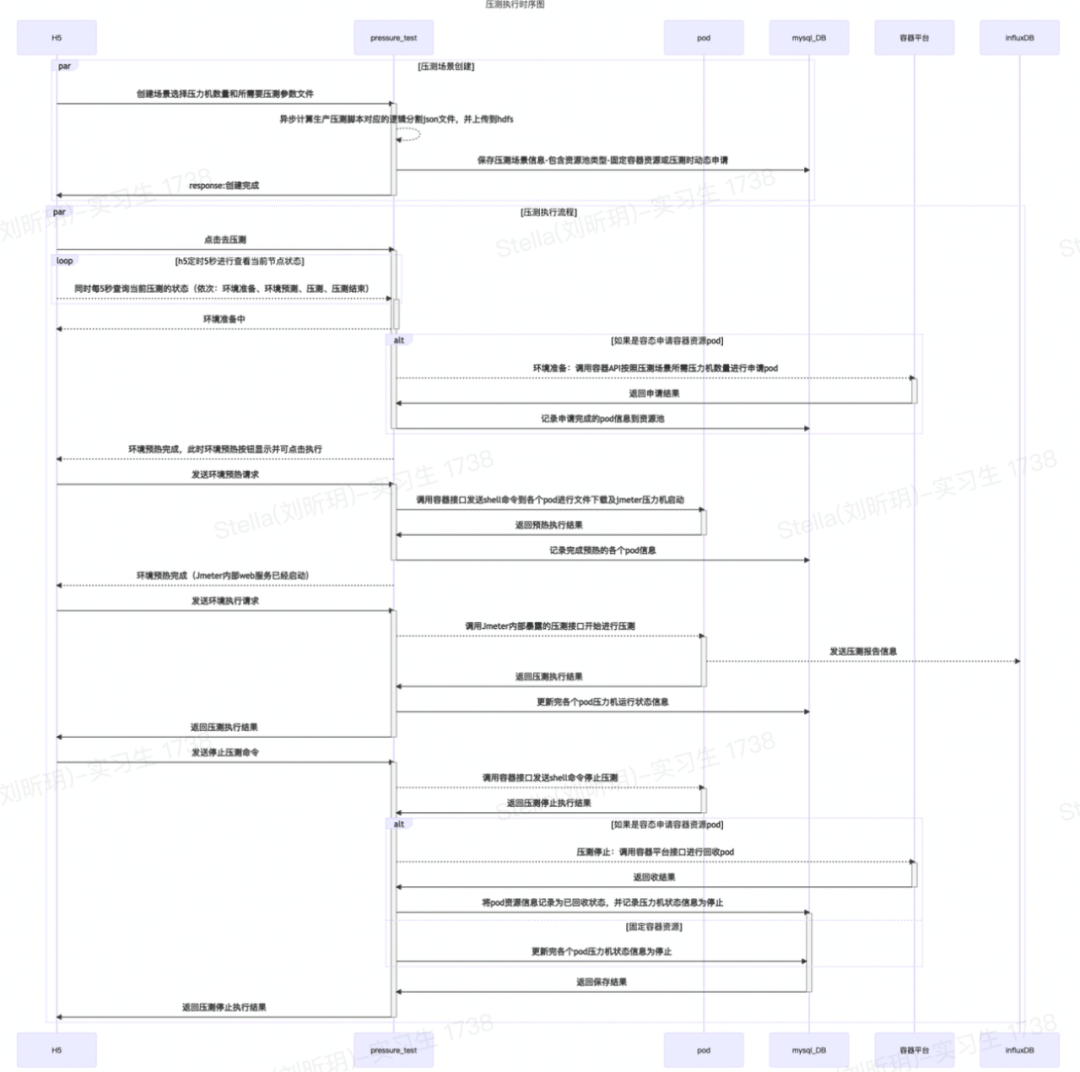
This stage includes the creation of the pre-pressure scene, the dynamic creation of the press container, the application of pressure, and the reporting of the pressure test report.
Pressure test execution sequence diagram:
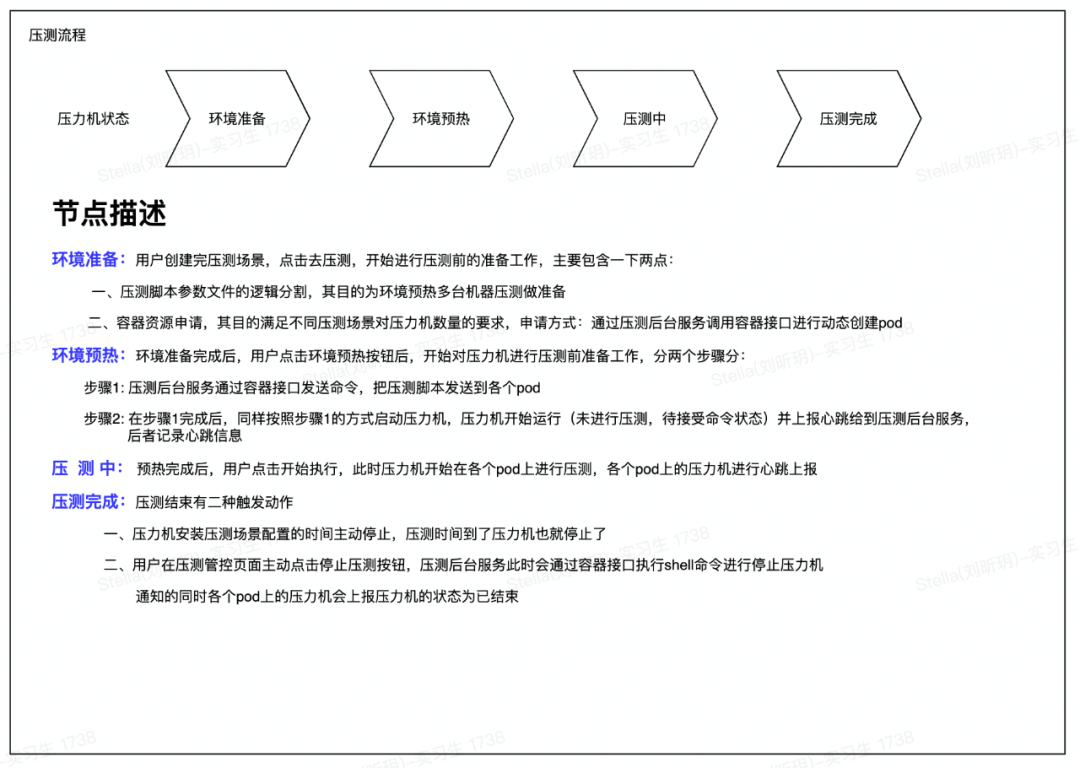
The flow of pressure measurement nodes:
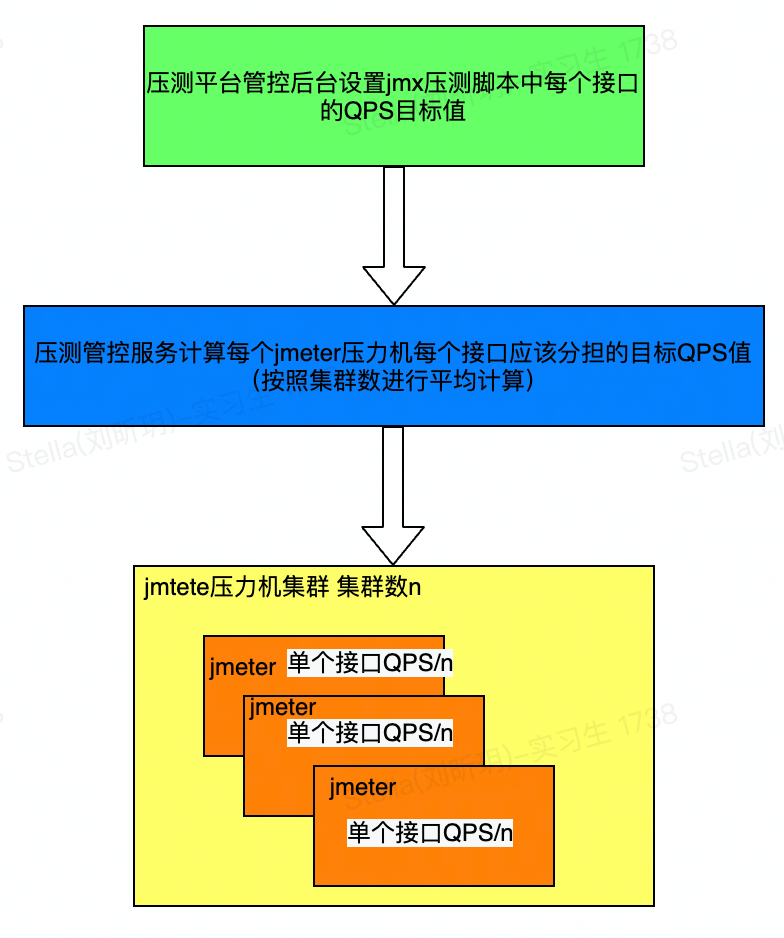
Implementation of throughput mode current limiting:
The throughput mode is to fix the QPS for pressure measurement, and the implementation logic is as follows:
3.2 Stress testing life cycle
The stress testing life cycle is roughly divided into three stages: before stress testing, during stress testing, and after stress testing. Next, install these three stages to describe the main work and processes of the stress testing platform in each stage, hoping to help you understand Stress testing logic and what exactly did it do.
Before stress test
Preparations for the stress testing platform before stress testing: estimating and applying for press resources, developing and debugging the stress testing script file JMX, developing and uploading parameter files (uploading to the stress testing platform), and interfaces under the stress testing thread group The setting of the QPS target value.
stress testing
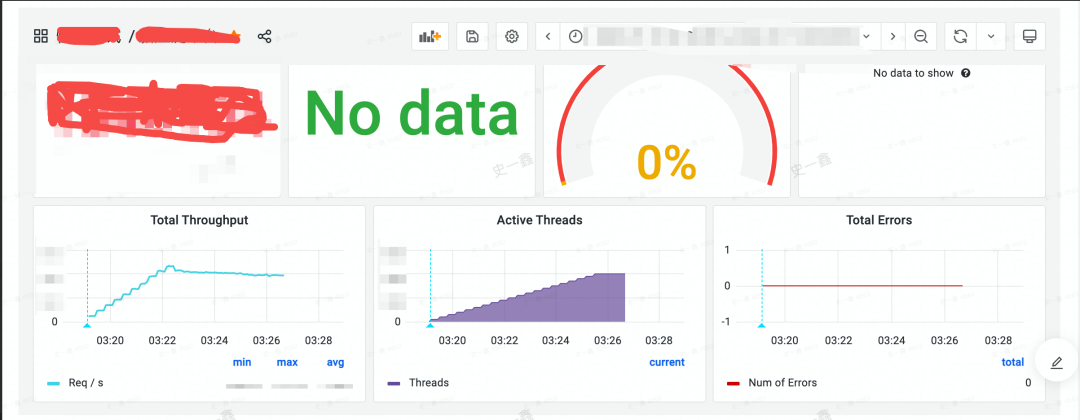
The management and control page automatically fills the JMeter listener BackendListener listener for the uploaded JMX file and sets the instance address of the InfluxDB timing library to collect the pressure measurement data, and uses the self-built grafana to pull the pressure measurement data for rendering. The monitoring includes: The total number of requests, the total number of errors, the total QPS/TPS, the interface dimension QPS/TPS, the press dimension QPS/TPS, the average RT, and the 95lineRT are monitored and displayed visually, as shown below:
After stress test
The stress test report is calculated and produced after the stress test is completed. When the press reports the heartbeat of the end state, the stress test management and control service asynchronously obtains the stress test data in InfluxDB through the unique number of the stress test, calculates and stores it in MySQL, and stores the line graph metadata. The information is saved to the distributed file system HDFS built by the company through JSON file information.
Pressure test results
The average CPU usage of the press is 30%, and the average memory usage is 50%. The memory and IO of the self-built influnDB server are very healthy.
4. Stress test summary
The stress measurement platform mainly solves the decentralization of the JMeter cluster and solves the single point bottleneck. Three points need to be considered:
First of all, you need to consider the clustering method and startup method (the architecture diagram will not be shown here). The JMeter centralized cluster is to configure the IP and PORT of each node through the configuration file to remotely start each slave node through the Java RMI protocol, decentralization After that, there is no master node for management, and the cluster configuration file is removed. Each node is a master node, and there is no interdependence. By sending shell commands, each node can be started concurrently and remotely.
Second, consider the pressure of storing the pressure measurement metadata storage DB (InfluxDB time series library). This point needs to be explained, because the JMeter cluster reporting the pressure measurement metadata information logic is reported to the master node through the Java RMI protocol through the slave node (here is the reason for the performance bottleneck of the master node), and the master node is passing the configured listener. It is reported to InfluxDB. After decentralization, there is no concept of master-slave. Therefore, each node must report the pressure measurement metadata to the time series database. Therefore, influxDB has a large write pressure and read pressure. InfluxDB needs to be considered here. performance optimization, such as clustered deployment, performance tuning, etc.
Then, the collection and aggregation of the stress test report, the monitoring in the stress test combined with grafana to customize the configuration and aggregation script statements are completed. The same principle is used for the stress test report. After solving the above three problems, the high-concurrency full-link pressure measurement can be configured with the number of presses according to the pressure measurement target to meet the pressure measurement requirements.
5. Future Outlook
The pressure testing platform has undergone several rounds of large-scale pressure testing, and now it has met the capability of high-throughput pressure testing.
We have also made follow-up plans for the development of the pressure measurement platform in the future in terms of efficiency improvement, easy-to-use functions, and automatic performance analysis:
- Construct pressure measurement data through data cleaning, data desensitization, and data amplification to reduce the pressure of data construction;
- Support the modification of online pressure measurement throughput;
- Support online editing of main JMX components (more fool-friendly for users, shielding the learning cost of JMeter);
- Support pressure testing of other protocols proposed by users, eg: RocketMQ, etc.; support automatic analysis of pressure testing results to determine the interface compliance rate;
- Support interface self-fusing, no need to manually track the disk; support automatic pressure prediction plan;
- Supports linked traffic recording to automatically generate JMX scripts for stress testing, and can give optimization suggestions in combination with related performance analysis components.
The Dewu pressure measurement platform has been continuously improved and improved. I hope this article can provide some reference experience in the construction of the pressure measurement platform.
*Text/Shi Yixin
@德物科技public account


**粗体** _斜体_ [链接](http://example.com) `代码` - 列表 > 引用。你还可以使用@来通知其他用户。