使用气象、环境类空间数据绘制等值线通常是由 NCL、Python 来做,在一些场景中:
- 你只是想在 WEB 端做一些简单的绘制
- 你的后端只有 Node.js 环境
- 你纯粹是个前端工程师
你也许需要使用纯 Javascript 来做这件事。本文尝试根据空间中的一组散点来绘制等值线图(或色斑图)。
1. 准备工作
- turfjs, 空间分析(geospatial analysis)工具包,支持在浏览器和 Node.js 环境中运行,空间数据的输入输出使用 GeoJSON 编码。本文对应的版本是 turfjs@5.1.6 。
- 一组散点数据,这是业务数据了,可以是一些观测点的温度或PM2.5。
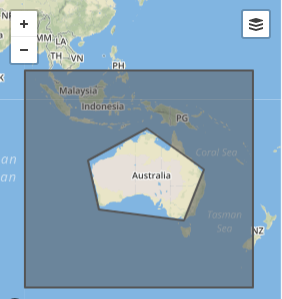
- 一个边界,用于裁剪出一幅针对某一区域干净的色斑图,格式为 GeoJSON。推荐使用 geojson.io 来查看或编辑这类数据,这里给出一个城市的
boundaries做示例。 - Mapbox, 一个 WebGIS 引擎,用来渲染输入、输出以及以一些中间数据。
- Codepen ,一个交互式的在线前端 IDE,这不是等值线绘制必备的工具,只是为演示这个过程提供一个载体。
2. 基本流程
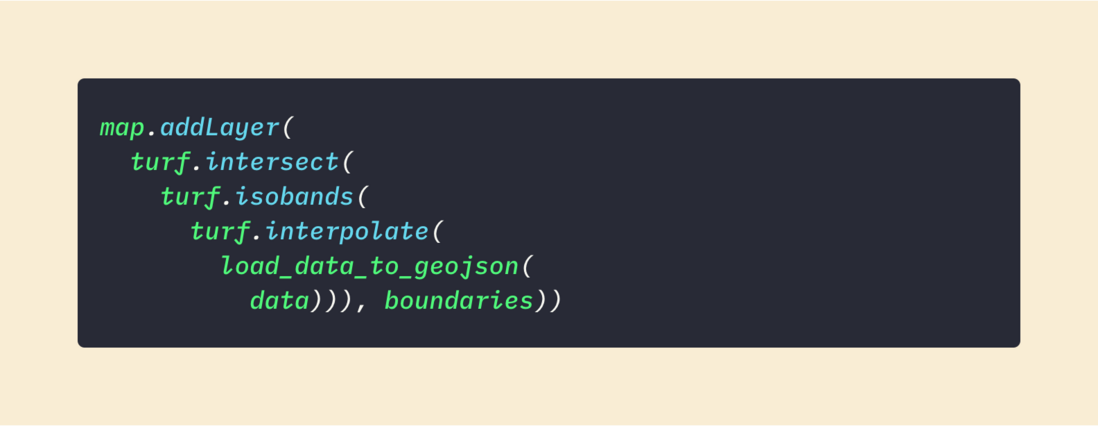
基本流程就是这样一串操作 —— 散点(Points)经过插值、等值线绘制、裁剪和渲染展示。按照 turfjs 的哲学,各个函数间传递GeoJSON 数据。
3. load_data_to_geojson()
一般业务数据往往是一个数组,大概是这样
var data = [
    {"Lat":36.18,"Lon":103.75,"value":1.7},
    {"Lat":36.17,"Lon":103.29,"value":1},
    {"Lat":37.98,"Lon":102.75,"value":4},
    {"Lat":36.59,"Lon":104.91,"value":3},
    {"Lat":36.22,"Lon":107.78,"value":0.1}
]
你需要把 data 转为一组 feature。 array.map() 大法好~
var features = data.map(i => {return {
      type: "Feature",
      properties: {
        value: i.value
      },
      geometry: {
        type: "Point",
        coordinates: [i.Lon, i.Lat]
      }
    }
  }
)
var points = turf.featureCollection(features);
你没有业务数据? 那就随机来一些
var points = turf.randomPoint(30, { bbox: turf.bbox(boundaries) });

//再生成些随机数做属性
turf.featureEach(points, function (currentFeature, featureIndex) {
  currentFeature.properties = { value: (Math.random() * 100).toFixed(2) };
});
4. turf.interpolate()
turf.interpolate() 提供了基于 IDW(反距离权重)算法的将数据插值为格点的方法。插值的精度是由第二个参数与 interpolate_options.units 共同决定的,单位支持 degrees, radians, miles, or kilometers,IDW 要为每个格点计算所有散点的权重,计算规模是 (散点数 * 格点数),所以要在精度与性能间做好平衡。 我们将之前的散点(points)代入
var interpolate_options = {
  gridType: "points",
  property: "value",
  units: "degrees",
  weight: 10
};
var grid = turf.interpolate(points, 0.05, interpolate_options);
// 适当降低插值结果的精度便于显示
grid.features.map((i) => (i.properties.value = i.properties.value.toFixed(2)));
5. turf.isobands()
这一步基于插值获得的格点绘制等值区域,并为区域配置颜色。turf.isobands() 根据 zProperty 分段,形成一些 MultiPolygon。
var isobands_options = {
  zProperty: "value",
  commonProperties: {
    "fill-opacity": 0.8
  },
  breaksProperties: [
    {fill: "#e3e3ff"},
    {fill: "#c6c6ff"},
    {fill: "#a9aaff"},
    {fill: "#8e8eff"},
    {fill: "#7171ff"},
    {fill: "#5554ff"},
    {fill: "#3939ff"},
    {fill: "#1b1cff"}
  ]
};
var isobands = turf.isobands(
  grid,
  [1, 10, 20, 30, 50, 70, 100],
  isobands_options
);
到这步,你就有了覆盖整个格点的色斑图。
6. turf.intersect()
这一步,我们利用准备的边界来裁剪整个色斑图。这里要用到 turf.intersect(),根据文档,这里输入的参数要 Feature<Polygon\> ,而我们拿到的是 MultiPolygon,需要先 flatten() 处理一下。
boundaries = turf.flatten(boundaries);
isobands = turf.flatten(isobands);
之后对每个 Polygon 做一次 intersect() 操作。
var features = [];

isobands.features.forEach(function (layer1) {
  boundaries.features.forEach(function (layer2) {
    let intersection = null;
    try {
      intersection = turf.intersect(layer1, layer2);
    } catch (e) {
      layer1 = turf.buffer(layer1, 0);
      intersection = turf.intersect(layer1, layer2);
    }
    if (intersection != null) {
      intersection.properties = layer1.properties;
      intersection.id = Math.random() * 100000;
      features.push(intersection);
    }
  });
});

var intersection = turf.featureCollection(features);
6.1 异常处理
色斑图绘制之后,可能会生成一些非法 Polygon ,例如 在 hole 里存在一些形状(听不懂?去查一下 GeoJSON 的规范),我遇到的一个意外情况大概是这样,这种 Polygon 在做 intersect() 操作的时候会报错,所以在代码中做了个容错操作。解决的方法通常就是做一次 turf.buffer() 操作,这样可以把一些小的碎片 Polygon 清理掉。
6.2 性能
这个操作的计算量很大,在使用精细边界时,运行耗时甚至超过插值过程,所以如果仅仅是为了渲染一个边界范围内的色斑图,那建议利用 turf.mask() 做一个遮罩,在 WebGIS 引擎里叠加到色斑图层之上,可以达到预期的效果。
7. map.addLayer()
最后一步工作就是形成的色斑 GeoJSON 叠加到地图上了,这里使用 MapBox 来实现,利用其 expressions 功能,可以很便捷的实现一些样式渲染和交互效果。
  map.addSource("intersection", {
    type: "geojson",
    data: intersection
  });  map.addSource("intersection", {
    type: "geojson",
    data: intersection
  });
  map.addLayer({
    id: "intersection",
    type: "fill",
    source: "intersection",
    layout: {},
    paint: {
      "fill-color": ["get", "fill"],
      "fill-opacity": [
        "case",
        ["boolean", ["feature-state", "hover"], false],
        0.8,
        0.5
      ],
      "fill-outline-color": [
        "case",
        ["boolean", ["feature-state", "hover"], false],
        "#000",
        "#fff"
      ]
    }
  });
8. 结论
综上,通过一串操作,我们使用 turfjs 实现了散点数据的等值线绘制和渲染,最终的效果请访问 Codepen 。对比在 Python 或 NCL, Javascript 虽然完成了任务,但略显业余,比如,在 Javascript 生态中,达到业务应用水平的插值的算法实现非常少。性能方面,本文给出的方案在浏览器中表现只能应对非常有限的数据规模,仍可以通过空间数据索引、控制插值计算规模等方法进行优化。


**粗体** _斜体_ [链接](http://example.com) `代码` - 列表 > 引用。你还可以使用@来通知其他用户。