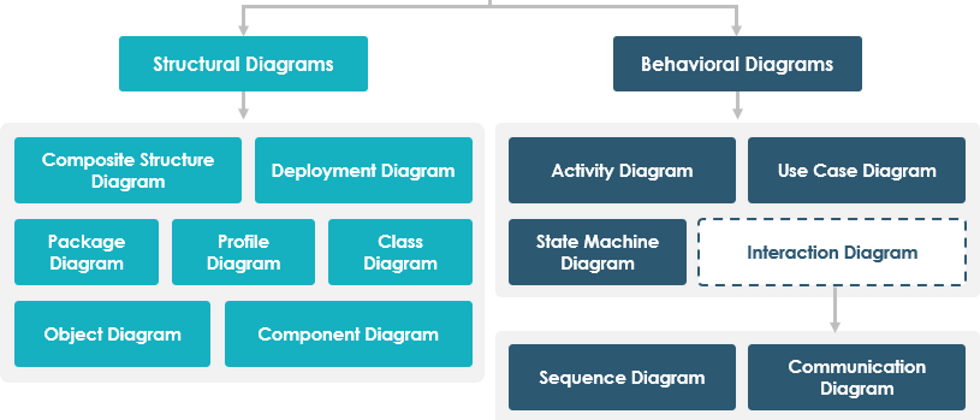
Understanding UML and its basic concepts is equivalent to learning most (if not all) knowledge of SE. UML is composed of 14 different types of diagrams, and these 14 UML diagrams are rarely used by one person. Each diagram has a specific purpose in SE, and modelers need to understand the purpose. The specific nature and purpose of the chart determine its use of pipelines and locations in modeling. For example, some diagrams provide an excellent way to understand system requirements and behavior (such as use case diagrams and activity diagrams). Other diagrams provide a robust mechanism to model data storage (for example, class diagrams). There is another set of UML diagrams to help visualize the software architecture (for example, component and deployment diagrams).
14 UML diagrams
We list all 14 UML diagrams here to provide a brief description of these UML diagrams. Although these diagrams constitute the toolbox of modeling technology, they are not completely independent of each other. These diagrams and the artifacts in them can visualize all aspects of the software system. The corresponding specifications and files further supplement these charts.
- Use case diagram ( use case Diagram )-outlines the functions of the system or business process from the user's point of view. The user "uses" the system's pipeline is the starting point for creating use case diagrams.
- Activity diagram ( activity diagram )-Model the flow anywhere in the system. In particular, the processes describing normal user interactions as well as alternatives and exceptions in use cases are well modeled by these activity diagrams.
- Class Diagram ( )-Represents classes and their definitions and relationships. The classes and entities in the problem space are also detailed technological entities in the solution space. The content and operations of the defined class are included in this type of diagram. The relationships in the class diagram illustrate how classes interact, cooperate, and inherit from other classes. Classes can also represent relational tables, user interfaces, and controllers.
- Sequence Diagram ( )-Model the interaction between objects according to their timeline. Objects can be specifically displayed on these diagrams, or they can be anonymous objects belonging to a class. The order of execution of messages between objects at runtime is well modeled by these diagrams, given their names.
- Interaction Overview Diagram ( )-A general, high-level overview of the interactions within the system; it can also understand how UML diagrams (for example, sequence diagrams) are interdependent and related.
- Communication Diagram ( )-shows how objects communicate with each other (interaction) in memory at runtime. These communication diagrams are similar to sequence diagrams in usage; however, their representation is different.
- Object Diagram ( )-Displays objects in memory and their connections at runtime. For this reason, these object diagrams also help to visualize diversity in practice.
- State Machine Diagram ( )-Shows the runtime life cycle of objects in memory. Such a life cycle includes all the states of the object and the conditions for state changes.
- Composite Structure Diagram ( behavior of components or objects at runtime, showing the layout, relationships and instances of components during system execution
- Component Diagram ( )-Structurally model components and their relationships. For example, these components can include executable files, linkable libraries, Web services, and mobile services. These diagrams add value to the system's architectural decisions.
- Deployment Diagram ( )-Model the system's hardware nodes and processor architecture, and provide an opportunity to show the nodes where the software components will reside.
- Package Diagram ( )-Represents the subsystems and areas of the system organization. It can also model dependencies between packages and help separate business entities from user interfaces, databases, security, and management packages.
- Timing Diagram ( concept of time and the pipeline that the state of the object changes over time. In addition, these graphs allow the state of multiple objects to be compared at the same time.
- Profile Diagram ( creation of extensible profiles that can be applied to elements inherited from the profile. These charts add value by extending the standard with a controlled pipeline.
Other UML references
- What is UML Collaboration Diagram?
- UML Association vs Aggregation vs Composition
- UML Class Diagram Tutorial
- How to Model Constraints in UML?
- State Machine Diagram vs Activity Diagram
- How to Identify Actors?
- Types of Actor in Use Case Model
- What is Model-View and Control?
- How to Model MVC Framework with UML Sequence Diagram?
- UML - Behavioral Diagram vs Structural Diagram
- What is UML Extensibility Mechanism?
- UML Practical Guide - All you need to know about UML modeling
- UML Modeling, Software Process and Tool
- UML - Modeling Software Architecture with Packages
- All You Need to Know about State Diagrams


**粗体** _斜体_ [链接](http://example.com) `代码` - 列表 > 引用。你还可以使用@来通知其他用户。