Hello everyone, I am Li Huangdong from Alibaba Cloud. Today, I will share the second part of the Kubernetes monitoring public class: How to find abnormalities in services and workloads in Kubernetes.
This sharing consists of three parts:
1. There are pain points in abnormal positioning of Kubernetes;
2. In response to these pain points, how can Kubernetes monitoring find abnormalities faster, more accurately, and more comprehensively;
3. Analysis of typical cases such as network performance monitoring and middleware monitoring.
Kubernetes abnormal positioning has pain points
In the current Internet architecture, more and more companies adopt an architecture like microservices + Kubernetes. Such an architecture has the following characteristics:
- First, the application layer is based on microservices. Microservices are composed of several decoupled services that call each other. The general responsibilities of the services are clear and the boundaries are clear. The result is that a simple product has dozens or even hundreds of microservices. The inter-dependence and call are very complicated, which brings a relatively large cost to the positioning problem. At the same time, the owner of each service may come from different teams, different developers, and may use different languages. The impact on our monitoring is that we need to access monitoring tools for each language, and the return on investment is low. Another feature is multi-protocol. Almost every type of middleware (Redis, MySQL, Kafka) has its own unique protocol. How to quickly observe these protocols is no small challenge.
- Although Kubernetes and containers shield the upper-layer application from the complexity of the bottom layer, it brings two results: the infrastructure layer is getting higher and higher; the other is that the information between the upper-layer application and the infrastructure becomes more and more complicated. For example, users report that website access is slow, and the administrator checks the access log, service status, and resource level and finds that there is no problem. At this time, I don’t know where the problem is. Although I suspect that there is a problem with the infrastructure, it cannot be delimited. Only one by one can be investigated and the efficiency is low. The root of the problem is the lack of connection between upper and lower problems between upper-layer applications and infrastructure, and end-to-end connection cannot be achieved.
- The last pain point is that the data is scattered, the tools are too many, and the information is not connected. For example, suppose we receive an alarm and use grafana to view the indicators. The indicators can only be described roughly. We have to look at the log. At this time, we have to go to the SLS log service to see if there is a corresponding log. No problem, at this time we need to log in to the machine to view it, but logging in to the container may cause the log to disappear due to restart. After checking a wave, we might think that the problem might not be in this application, so we went to see if there was a downstream problem with link tracking. All in all, a lot of tools were used, and the browser opened a dozen windows, which was inefficient and poor experience.
These three pain points are summarized into three aspects: cost, efficiency, and experience. In response to these pain points, let's take a look at the data system monitored by Kubernetes and see how to better solve the three major problems of cost, efficiency, and experience.
How Kubernetes monitoring finds anomalies
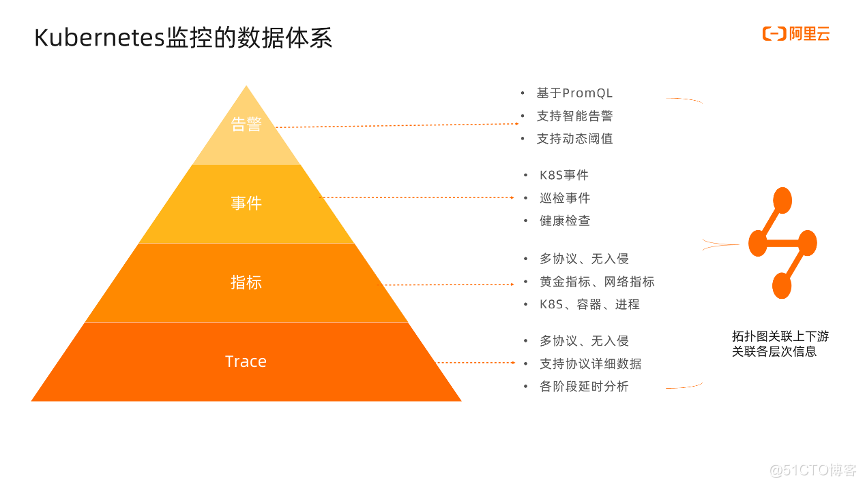
The figure below shows the density or level of detail of the information from the top to the bottom of the tower of gold. The more you go, the more detailed the information. Let’s start from the bottom. Trace is our use of eBPF technology to collect application layer protocol data in a non-invasive, multi-protocol, and multi-language manner, such as HTTP, MySQL, and Redis. The protocol data will be further parsed into easy-to-understand request details and response details. , Time-consuming information of each stage.
The next level is indicators, which are mainly composed of gold indicators, networks, and indicators in the Kubernetes system. Among them, the gold indicators and network indicators are collected based on eBPF, so they are also non-invasive and support various protocols. With the gold indicators, we can know whether the service as a whole is abnormal, whether it is slow, and whether it affects users; Network indicators are mainly support for sockets, such as packet loss rate, retransmission rate, RTT, etc., which are mainly used to monitor whether the network is normal. The indicators in the Kubernetes system refer to the indicators of cAdvisor/MetricServer/Node Exporter/NPD in the original Kubernetes monitoring system.
The next level is events, which directly and clearly tell us what happened. Perhaps the most common problems we encounter are Pod restarts, failures to pull mirrors, etc. We persistently store Kubernetes events and save them for a period of time, which is convenient for locating problems. Then, our inspections and health checks also support reporting in the form of incidents.
The top layer is alarms. Alarms are the last link of the monitoring system. When we find that certain abnormalities may damage the business, we need to configure alarms for indicators and events. Alarms currently support PromQL, and smart alarms support intelligent algorithm detection of historical data to discover potential abnormal events. The alarm configuration supports dynamic thresholds. The alarms can be configured by adjusting the sensitivity to avoid writing dead thresholds.
After having traces, indicators, events, and alarms, we use topology diagrams to associate these data with Kubernetes entities. Each node corresponds to the services and workloads in the Kubernetes entities, and the calls between services are represented by lines. With a topological map, we are just like getting a map, which can quickly identify anomalies in the topological map, conduct further analysis on the anomalies, and analyze the upstream and downstream, dependency, and influence surfaces, so as to have a more comprehensive view of the system. Take control.
Best practice & scenario analysis
Next, let's talk about the best practices for discovering anomalies in services and workloads in Kubernetes.
First of all, there are indicators that can reflect the monitoring status of the service. We should collect as many indicators as possible, and the more comprehensive the better, not limited to gold indicators, USE indicators, Kubernetes native indicators, etc.; then, indicators are macro data, We need to do root cause analysis. We need to have trace data. In the case of multiple languages and multiple protocols, we must consider the cost of collecting these traces. Also, support more protocols and more languages as much as possible; finally, use a topology to combine indicators and traces. , Events are aggregated and connected in series to form a topology diagram for architectural perception analysis and upstream and downstream analysis.
Through the analysis of these three methods, the abnormalities of services and workloads are usually exposed, but we shouldn’t stop our progress. If we add this anomaly, we will come again next time. Then we have to do all the work again. The best way is The alarms corresponding to this type of abnormal configuration are automatically managed.
We use several specific scenarios to introduce in detail:
(1) Network performance monitoring
Network performance monitoring takes retransmission as an example. Retransmission means that the sender thinks that packet loss has occurred and retransmits these data packets. Take the transmission process in the figure as an example:
- The sender sends the packet numbered 1, and the receiver accepts it and returns ACK 2
- The sender sends a packet numbered 2, and the receiver returns ACK 2
- The sender sends packets numbered 3, 4, and 5, and the receiver returns ACK 2
- Until the sender receives the same ACK 3 times, the retransmission mechanism will be triggered, and the retransmission will increase the delay
Code and logs cannot be observed. In this case, it is difficult to find the root cause in the end. In order to quickly locate this problem, we need a set of network performance indicators to provide positioning basis, including the following indicators, P50, P95, P99 indicators to indicate delay, and then we need traffic, retransmission, RTT, packet loss indicators to characterize Network conditions.
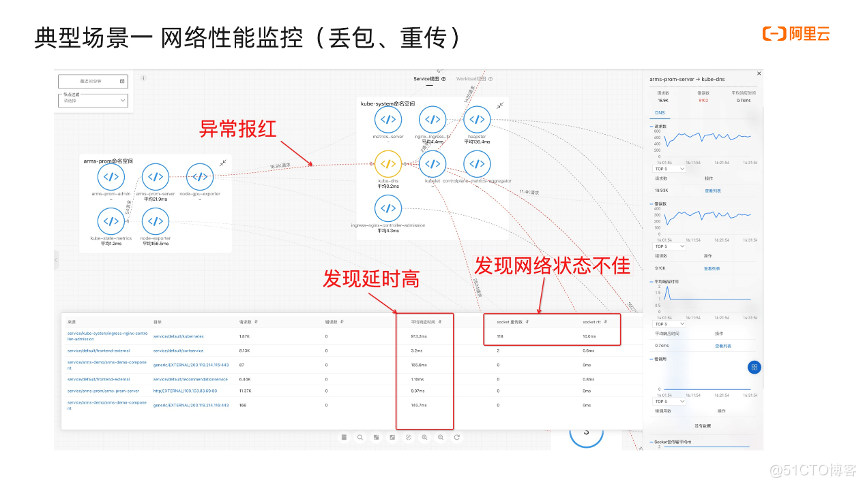
Take a certain service RT high as an example: first we see that the edge of the topology is red, and the red judgment logic is judged based on delay and error. When this red edge is found, click on the upper edge to see The corresponding gold indicator.
Click the leftmost button at the bottom to view the network data list of the current service. We can sort by average response time, retransmission, and RTT. You can see that the first service call delay is relatively high, and the return is as fast as one second. Time, but also see that the retransmission is relatively high, much higher than other services. In fact, a fault such as high retransmission is injected through tools, which seems more obvious. After this analysis, we know that it may be a network problem, and we can further investigate. Experienced developers will generally take information such as network indicators, service names, ip, and domain names to check with colleagues on the network, instead of just telling the other party that my service is slow, so that the other party knows too little information and will not actively go Investigate, because others don’t know where to start. When we provide relevant data, the other party will have a reference and will proceed further along the way.
(2) DNS resolution is abnormal
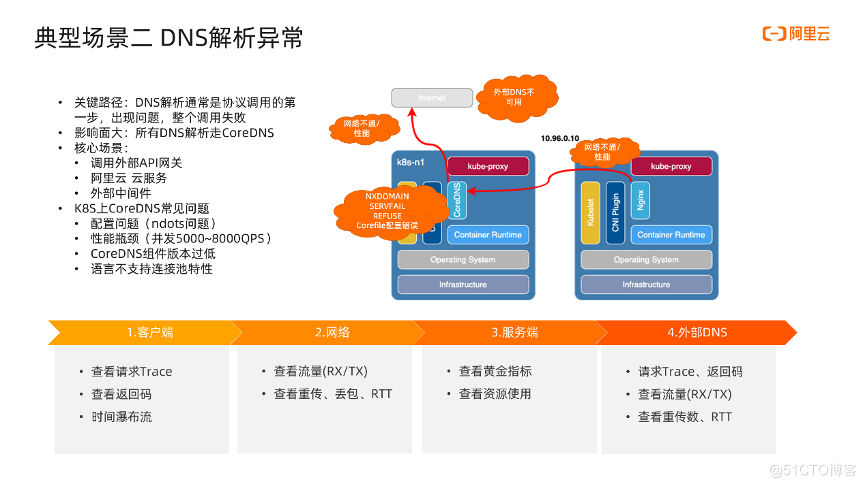
The second scenario is an abnormal DNS resolution. DNS is usually the first step of protocol communication, such as HTTP requests. The first step is to get the IP first, which is what we usually call the service discovery process. If there is a problem in the first step, the entire call will fail directly. This is the so-called key The path cannot be dropped. All DNS in the Kubernetes cluster is resolved by CoreDNS, so CoreDNS is prone to bottlenecks. Once a problem occurs, the impact will be very large, and the entire cluster may be unavailable. To give a vivid example that happened two months ago, the famous CDN company Akamai had a DNS failure, which made many websites like Airbnb inaccessible, and the accident lasted as long as an hour.
There are three core scenarios for DNS resolution in a Kubernetes cluster:
- Call external API gateway
- Invoke cloud services, which are generally on the public network
- Call external middleware
Here is a summary of the common problems of CoreDNS. You can refer to it to check if there are similar problems on your cluster:
- Configuration problem (ndots problem), ndots is a number, which means that if the number of dots in the domain name is less than ndots, then the search will first go to the domain in the search list to find it. In this case, multiple queries will be generated, and the impact on performance is still quite large. of.
- Since all domain name resolutions in Kubernetes use CoreDNS, it is very easy to become a performance bottleneck. Some people have counted that when the qps is about 5000~8000, the performance problem should be paid attention to. Especially those that rely on external Redis and MySQL have relatively large traffic.
- The low version of CoreDNS has stability issues, which is also a point that needs attention.
- In some languages, I think that PHP does not support connection pool very well, which leads to the need to resolve DNS and create a connection every time. This phenomenon is also relatively common.
Next, let’s take a look at the areas where problems may occur in Kubernetes CoreDNS. First, there may be problems with the network between the application and CoreDNS; second, there may be problems with CoreDNS itself. For example, CoreDNS returns error codes such as SERVFAIL and REFUSE, or even because of Corefile configuration errors. The return value is wrong; the third point is that the network is interrupted and performance problems occur when communicating with the external DNS; the last one is that the external DNS is unavailable.
In view of these problems, the following steps are summarized to check:
First, from the client side, first look at the request content and return code. If the error code is returned, it means there is a problem with the server. If it is a slow analysis, you can look at the time waterfall to see at which stage the time is spent.
Second, to see whether the network is normal, it is enough to see the indicators of traffic, retransmission, packet loss, and RTT.
Third, look at the server, look at the indicators of traffic, error, delay, and saturation, and look at the resource indicators such as CPU, memory, and disk, and you can also locate whether there is a problem.
Fourth, look at the external DNS. In the same way, we can locate it by requesting trace, return code, network traffic, retransmission and other indicators.
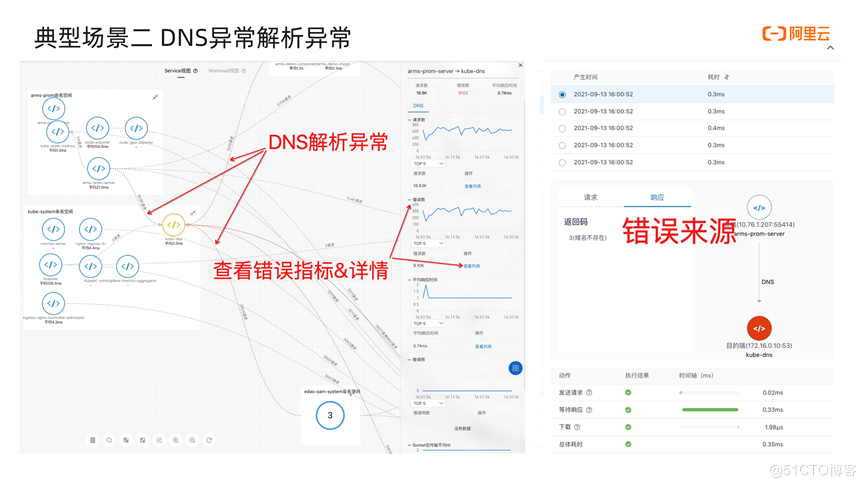
Next we look at the topology. First see the red line to indicate an abnormal DNS resolution call. Click this to see the golden indicator of the call; click to view the list, and the detail page will pop up to view the details of the request. This domain name is requested. The three processes of waiting and downloading seem to be normal. Next, we clicked to see the response and found that the response was that the domain name did not exist. So at this time, we can take a closer look at whether there is a problem with the external DNS. The steps are the same. I will show it in the demo later, so I won't start here.
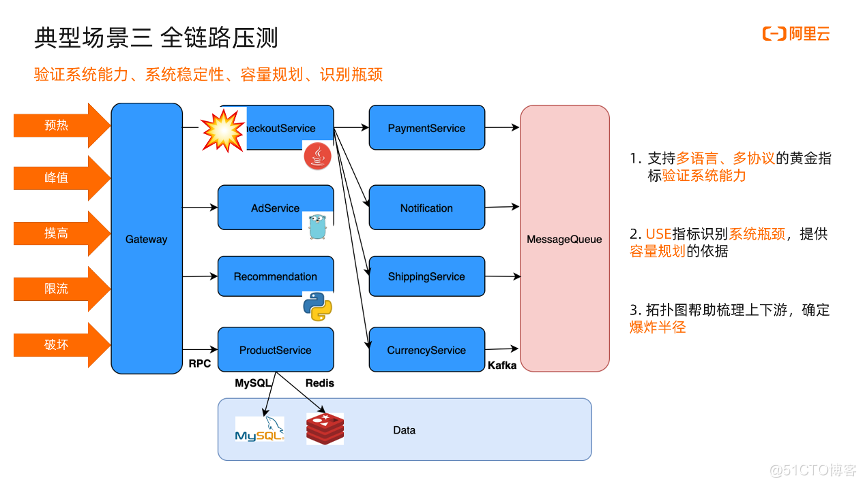
(3) Full link pressure test
The third typical scenario is a full-link stress test. The peak value of the big promotion is several times that of normal. How to ensure the stability of the big promotion requires a series of stress tests to verify system capabilities, evaluate system stability, and do Capacity planning, identification of system bottlenecks. Generally, there are several steps: warm up first, verify that the link is normal at this time, gradually increase the traffic until the peak, and then start to touch the high, that is, see the maximum TPS that can be supported, and then increase the traffic At this time, it is mainly to see whether the service can limit the flow normally, because the maximum TPS has already been found, and increasing the power is destructive flow. So in this process, what points do we need to pay attention to?
First of all, for our multi-language, multi-protocol microservice architecture, such as Java, Golang, Python applications here, and RPC, MySQL, Redis, Kafka application layer protocols, we have to have golden indicators for various languages and protocols, It is used to verify system capabilities; for system bottlenecks and capacity planning, we need use indicators to look at the saturation of resources under various traffic levels to determine whether to expand capacity. For each increase in traffic, look at the corresponding use. Indicators, adjust capacity accordingly, and gradually optimize; for complex architectures, a big picture is needed to help sort out upstream and downstream dependencies, full link architecture, and determine explosion alarms. For example, CheckoutService here is a key service. If this point occurs The problem will have a great impact.
First, the golden indicators of communication in various languages and protocols. You can view the details of the call by viewing the list.
Second, click on the node details and drill down to view use resource indicators such as cpu and memory
Third, the entire topology map can reflect the shape of the entire architecture. With a global architecture perspective, it is possible to identify which service is likely to become a bottleneck, how large the explosion radius is, and whether high availability guarantees are needed.
(4) Access to external MySQL
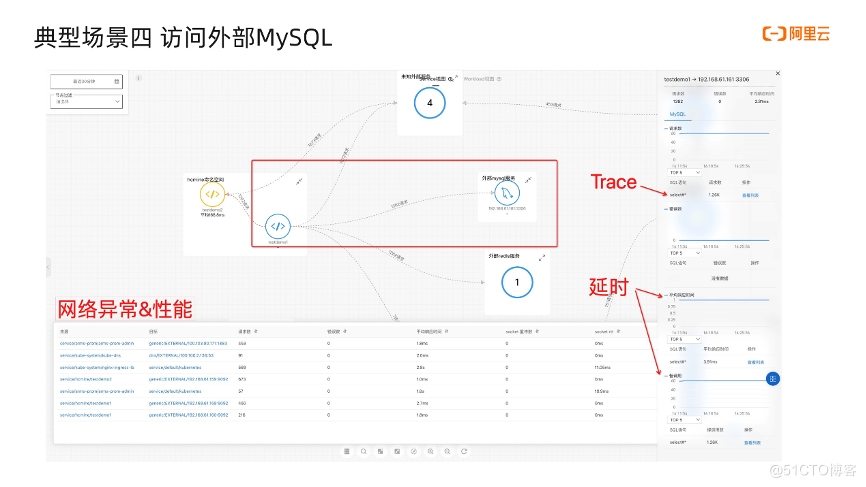
The fourth scenario is to access external MySQL. First, let's take a look at the common problems of accessing external MySQL:
- The first is slow query. Slow query withdrawal means that the delay index is high. At this time, look at the details of the request in the trace, which table and which fields are being queried, and then see if the query volume is too large and the table is too large. , Still said that there is no index and so on.
- The query statement is too large. We know that too large a query statement will lead to high transmission time. A slight network jitter will cause failure and retry, and will also cause the problem of bandwidth consumption. Generally it is caused by some batch updates and inserts. When this problem occurs, the delay index will soar. At this time, we can choose some traces with higher RT to see, see how the statement is written, and see the length of the query statement Is it too big?
- If the error code is returned, for example, if the table does not exist, it is very helpful to analyze the error code. If you look at the details inside and read the sentence, it is easier to locate the root cause.
- Network problems, this point has also been talked a lot, usually in conjunction with delay indicators plus RTT, retransmission, and packet loss to determine whether there is a problem with the network.
Next, look at the topology diagram. The application in the middle frame relies on the external MySQL service. Click the topology line to see the golden indicators, and click the view list to see the details of the request, response, etc. At the same time, we can also look at the network performance indicators. This table categorizes the network data in the current topology according to the source and target. You can view the number of requests, the number of errors, the average response time, socket retransmission, and socket rtt. Click above The arrows can be sorted accordingly.
(5) Multi-tenant architecture
The fifth typical case is the multi-tenant architecture. Multi-tenant refers to different tenants, workloads, different teams, sharing a cluster, usually a tenant corresponds to a namespace, while ensuring the logical or physical isolation of resources without affecting or interfering with each other. Common scenarios are: internal users of an enterprise, a team corresponds to a tenant, the network in the same namespace is not restricted, and network policies are used to control network traffic between different namespaces. The second is the multi-tenant architecture of the SaaS provider. Each user corresponds to a namespace, and the tenant and the platform are in different namespaces. Although the namespace feature of Kubernetes brings convenience to the multi-tenant architecture, it also brings two challenges to the observable: The first is that there are many namespaces, and it becomes cumbersome to find information, which increases management and understanding costs. The second is that there is a requirement for traffic isolation between tenants. When there are more namespaces, it is often impossible to accurately and comprehensively find abnormal traffic. The third is Trace support for multi-protocol and multi-language. I once encountered a customer who had more than 400 namespaces in a cluster. It was very painful to manage, and the application was multi-protocol and multi-language. To support Trace, it had to be modified one by one.
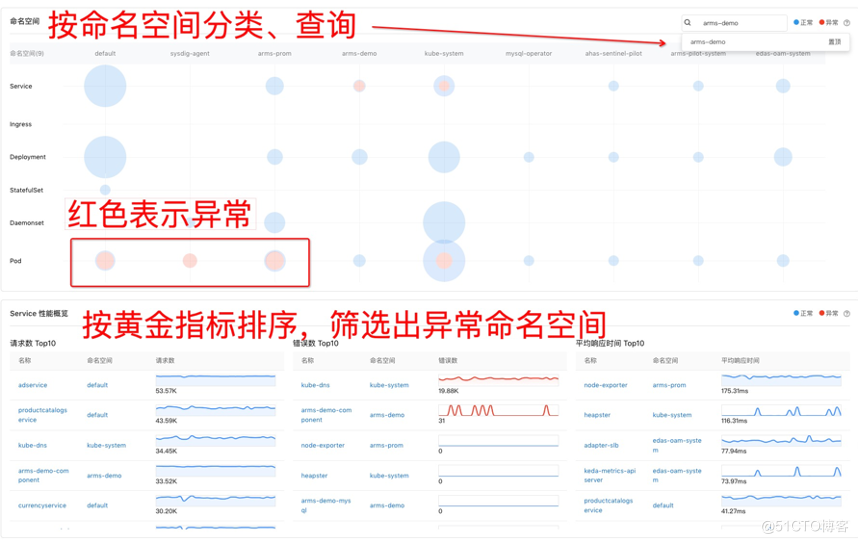
This is the cluster homepage of our product. The entities of Kubernetes are divided into namespaces and support queries to locate the clusters I want to see. The bubble chart shows the number of entities in the corresponding namespace and the number of entities with anomalies. For example, there are anomalous pods in the three namespaces in the box. Click to see the anomalies further. Below the home page is a performance overview sorted by golden indicators, which is the Top function of the scene, so that you can quickly check which namespaces are abnormal.
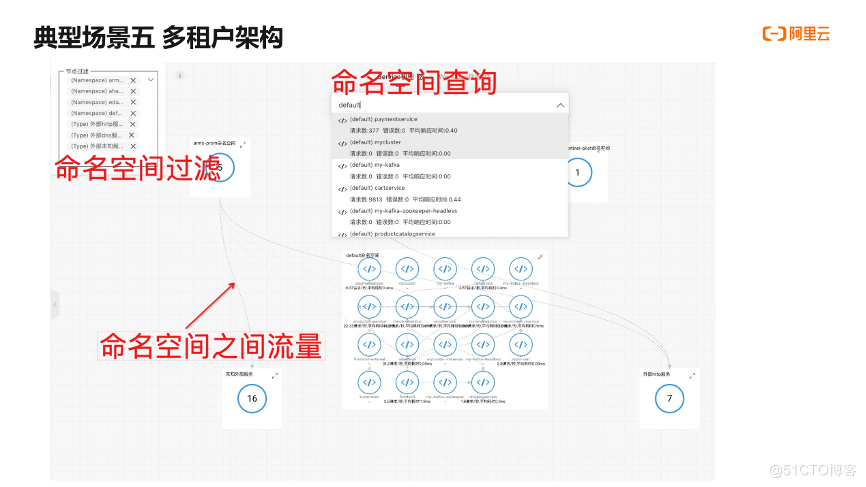
In the topology diagram, if there are many namespaces, you can use the filtering function to view the namespace you want to see, or quickly locate the namespace you want to see through the search method. Since the nodes are grouped by namespaces, the traffic of the namespaces can be viewed through the lines between the namespaces, so that you can easily check which namespaces the traffic comes from, whether there is abnormal traffic, and so on.
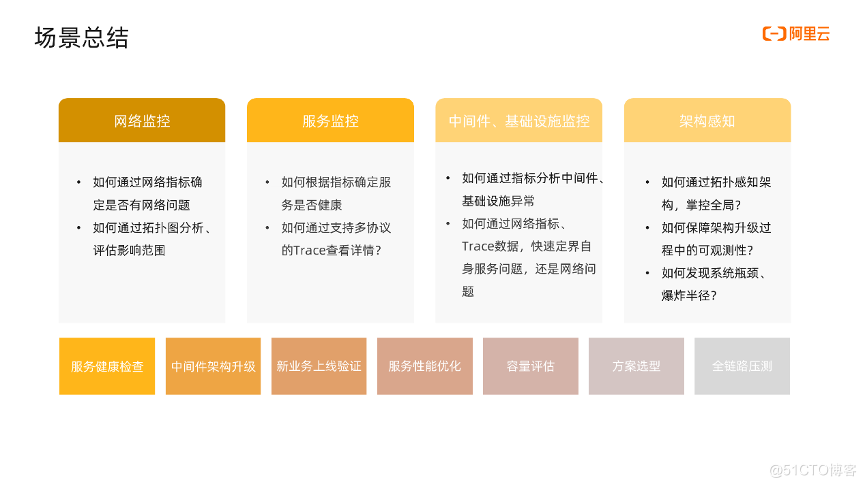
We summarize the above scene introduction as follows:
- Network monitoring: How to analyze the errors and interruptions of services caused by the network, and how to analyze the impact of network problems
- Service monitoring: How to determine whether the service is healthy through the gold indicator? How to view details through Trace that supports multiple protocols?
- Middleware and infrastructure monitoring: how to use golden indicators and traces to analyze the abnormalities of middleware and infrastructure, and how to quickly delineate whether it is a network problem, an own problem, or a downstream service problem
- Architecture awareness: How to perceive the entire architecture through topology, sort out upstream and downstream, internal and external dependencies, and then control the overall situation? How to ensure sufficient observability and stability through the topology assurance architecture, and how to discover the bottleneck and explosion radius in the system through topology analysis.
From these several scenarios, we further list common cases: network and service availability detection, health check; middleware architecture upgrade observability guarantee; new business online verification; service performance optimization; middleware performance monitoring; solution selection; Full link pressure test, etc.
product value
After the above introduction, we summarize the product value of Kubernetes as follows:
- Collect service indicators and trace data in a multi-protocol, multi-language, and non-intrusive manner to minimize the cost of access and provide comprehensive indicators and traces at the same time;
- With these indicators and Trace, we can perform scientific analysis and drill down on services and workloads;
- Link these indicators and Traces into a topology map, which can perform architecture perception, upstream and downstream analysis, context correlation, etc. on a large map, fully understand the architecture, evaluate potential performance bottlenecks, etc., to facilitate further architecture optimization;
- Provide a simple alarm configuration method, deposit experience knowledge into the alarm, and achieve active discovery.
This is the end of the content of this lesson. Welcome to the Dingding search group number (31588365) to join the Q&A exchange group for communication.
At present, Kubernetes monitoring has been fully tested for free. Click the link below to start the trial immediately!
https://www.aliyun.com/activity/middleware/container-monitoring?spm=5176.20960838.0.0.42b6305eAqJy2n





**粗体** _斜体_ [链接](http://example.com) `代码` - 列表 > 引用。你还可以使用@来通知其他用户。