Author |
Review & Proofreading:
Editing & Typesetting: Wen Yan
background
As a basic and important function of the Intelligent Operation and Maintenance (AIOps) system, anomaly detection aims to automatically find abnormal fluctuations in KPI time series data through algorithms, and provide decision-making basis for subsequent alarms, automatic stop loss, and root cause analysis. So, how do we use anomaly detection in actual scenes, and what is anomaly detection, today we will conduct an in-depth explanation.
What is anomaly detection?
Before everything starts, we first need to understand what anomaly detection is. Anomaly detection refers to identifying abnormal events and phenomena from time series or event logs. The anomaly detection we are talking about here specifically refers to time series anomaly detection. By comprehensively determining the value of the time series, the shape of the curve, etc., abnormal points of the curve can be found. Abnormal performance generally refers to the rise, fall or fluctuation of the time series that does not meet expectations.
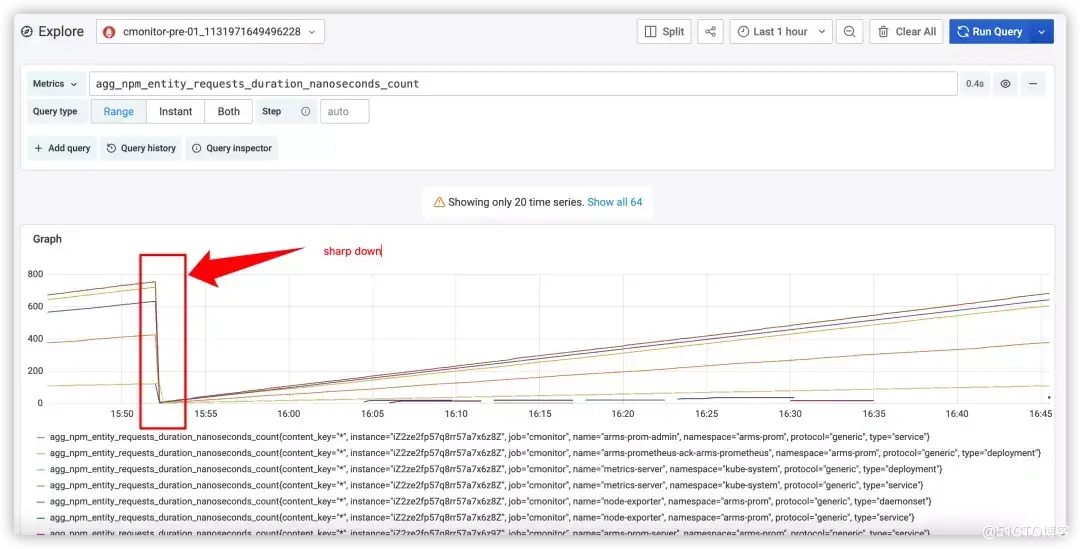
For example: the memory usage index of a machine has been fluctuating around 40%, and suddenly soars to 100%; the normal level of a certain Redis database connection has been around 100, and suddenly there has been a large-scale drop to 0 phenomenon; the number of online users of a business fluctuates around 100,000, suddenly drops to 50,000, and so on.
What is a time series?
A time series refers to a series of data points arranged in the order of occurrence of time. Usually, the time interval of a group of time series is a constant value (such as 1 minute, 5 minutes).
How does the current open source Prometheus do anomaly detection?
The current open source version of Prometheus's detection capability is still based on the way of setting threshold rules, and this way of relying on threshold setting leads to the following problems.
common problem
Question 1: In the face of tens of thousands of indicators, how to complete the detection configuration quickly and reasonably?
As the meanings of different types of indicators are quite different, the correspondingly set reasonable thresholds are also different. Even if the indicators are of the same type, the same threshold cannot be used due to different business conditions. Therefore, when configuring the threshold, the operation and maintenance personnel need to configure the threshold that they think is reasonable according to the corresponding business situation. Due to differences in the cognitive level and work experience of operation and maintenance personnel, there are also differences in the thresholds for different personnel allocation. Secondly, many indicators do not have clear and reasonable range definitions, which leads to many threshold configurations that are determined by "slap-head", and the randomness is relatively strong.
For example: a certain online population indicator must carefully observe and analyze the value distribution and change trend of the historical indicator curve in order to set a reasonable threshold.
Question 2: As the business evolves, how to maintain the inspection rules?
For a relatively stable business, the business indicators are in a stable state for a long time. In this case, the configured threshold can play a role for a relatively long time. But for the constantly changing business, with the continuous evolution of the business, the level and trend of the indicators are also constantly changing. These changes can easily lead to the threshold detection set at the beginning, but after a period of time, it does not meet the detection status quo. At this time, operation and maintenance experts need to regularly check whether the detection threshold is still in line with the current detection requirements, and maintain and modify the unreasonable configuration. Therefore, the static threshold method has the problem of high maintenance cost.
For example: the throughput of a certain IO initially stabilized at around 10,000 and fluctuated around the value of 10,000. At the beginning, the detection threshold was set to alarm if it exceeded 20,000. However, with the development of the business, the IO throughput has stabilized at around 25,000. At this time, the threshold set at the beginning has caused a steady stream of alarms.
Question 3: How to solve the poor data quality?
Poor data quality is manifested in several specific phenomena: large collection delays, many missing data values, and many data glitches (the response on the curve is not smooth enough). For the first two types, more are targeted optimization from the acquisition and aggregation side. ARMS-Prometheus continues to optimize its collection capabilities. For the data quality problem with many data glitches, the static threshold method cannot effectively circumvent. In the smart operator of the ARMS-hosted version of Prometheus, we have effectively identified multiple glitches, ensuring that glitches will not form invalid alarms, and reducing user-side/O&M side nuisance.
How does Alibaba Cloud Prometheus monitoring solve these problems?
In the face of the above problems, the detection configuration capabilities of Alibaba Cloud Prometheus monitor not only support the native setting threshold detection method, but also fully support the template setting detection threshold method and intelligent detection operator method.
Business value 1: High-efficiency and high-quality alarm configuration
(1) To configure detection rules for clear application scenarios, Alibaba Cloud Prometheus Monitoring provides mature alarm configuration template, users do not need to manually set thresholds, only need to select the corresponding template.
For example: in the machine indicator scenario, configure the template of "cpu usage of machine indicator> 80%". The template approach solves the pain points of application scenarios where the configuration is clearly abnormal and the business is relatively stable.
(2) For ambiguous indicator scenarios or business indicator scenarios that are not easy to set, it is recommended to use the intelligent detection operator function.
For example, it is necessary to set a threshold for a certain online population indicator. In this case, it takes a long time to observe the state of the historical curve to configure a reasonable threshold. In this scenario, the user can directly select the smart detection operator.
Business value 2: Self-adaptive tracking of business changes, greatly reducing detection threshold maintenance costs
Alibaba Cloud Prometheus monitors the intelligent detection operator function. By setting parameters that refer to the length of historical data, the model can adaptively track changes in indicator trends without the need to manually review configuration rules on a regular basis.
Business value 3: Intelligent detection can also be achieved for indicators with poor quality and too many missing values/glitch points
In the intelligent detection operator function, if the historical data is missing, the algorithm can automatically fill in the missing values in various ways such as linear interpolation and polynomial interpolation.
For non-smooth indicator curve detection, the intelligent detection operator also adaptively selects the optimal model for the scene to detect, ensuring the overall detection effect.
How to apply in specific business scenarios
Sudden increase/sudden drop indicator of water level: qps indicator of a certain business
When the threshold is set at the beginning of the business, it is very likely that the threshold does not exceed 150 through observation. But with business iterations, qps indicators will also undergo various changes. In terms of indicators, it shows that there is a periodical sudden increase to a certain value, and then a stable state. In this case, the set static threshold is difficult to continuously meet the detection requirements. On the other hand, there will be sudden drops in stable conditions. Only the static threshold of the upper limit is used to detect this kind of decline. In this case, the intelligent detection operator can adaptively track changes in service levels and intelligently identify sudden increases or decreases in services.
Periodic indicators:
In the indicator profile module, if it is recognized that the current indicator has a certain period, the corresponding period value, period offset value, and overall trend curve will be extracted from it. After removing the periodicity and trend of the original time series, the residual error is used for anomaly detection. Take the cycle indicator in the above figure as an example, the cycle around 11.30 minutes is obviously different from other cycles. The traditional static threshold is difficult to solve the detection problem in such scenarios, and the use of intelligent detection operators can identify such anomalies.
Trend-breaking indicators:
In addition, there is another common type of indicator anomaly that in a certain period, the indicator has been showing an upward (or downward) trend. Sudden trend destruction occurs at a certain node, and the local trend is different from the overall trend. This type of abnormality is also very common, but the static threshold is difficult to set to solve this situation. The intelligent detection operator can accurately identify abnormalities for this type.
Best Practices
Alibaba Cloud Prometheus monitoring internal use process
At present, Alibaba Cloud Prometheus monitoring already supports the intelligent detection operator function. Just log in to ARMS-Prometheus/grafana and enter the corresponding PromQL.
Operator definition
"anomaly_detect": {
 Name: anomaly_detect",
ArgTypes: []ValueType{ValueTypeMatrix, ValueTypeScalar},
ReturnType: ValueTypeVector,
},
输入:指标的时间序列,类型为range vector;检测参数,使用默认的3即可
输出:异常返回1, 正常返回0
Use case:
anomaly_detect(node_memory_free_bytes[20m],3)- The input must be a range vector, so you need to add [180m] after the indicator name, the default time range is 180m, and the parameter default is 3
- If you perform other aggregate function operations first, you need to [180m:] to turn it into a range vector, as follows: anomaly_detect(sum(node_memory_free_bytes)[180m:],3)
Example of use:
Step 1: Log in to ARMS-Prometheus or Grafana and select the corresponding Prometheus data source
Select the corresponding data source:
step 2: Select the indicator, and view
Step 3: Input anomaly detection operator
About Prometheus- Intelligent Detection Operator
Alibaba Cloud Prometheus monitors intelligent detection operators and is designed by summarizing dozens of leading algorithm solutions in the industry. The index profile is established for common index types, and the best model is adaptively selected for detection and calculation. After each indicator data is input into the model, the model first establishes an indicator profile for the current indicator, including stability, jitter, trend, periodicity, whether it is a special holiday/event, etc. After constructing based on these portrait features, the model adaptively selects the best one or a combination of algorithms to solve the current index detection problem, ensuring the best overall effect. The currently supported functions include: sudden increase detection, glitch detection, cycle identification (identify periodicity, cycle offset).
Through the integration of intelligent detection operators in Alibaba Cloud Prometheus monitoring, we hope to provide users with out-of-the-box intelligent detection services that are continuously updated iteratively. At present, users can view and use smart detection operators in Alibaba Cloud Prometheus monitoring, and the native configuration smart detection alarm function based on ARMS and Grafana dynamic display will be launched in the near future.
👇 Click here , and immediately access Prometheus monitoring!


**粗体** _斜体_ [链接](http://example.com) `代码` - 列表 > 引用。你还可以使用@来通知其他用户。