
I introduced a data visualization tool 161e6263a02c25 , and found that everyone is still interested in this visualization tool. Recently, I found a data visualization tool Metabase with a very good interface. Compared with DataEase, this tool can be built in only 5 minutes, without complicated configuration, and it is very convenient to use. This really good tool out of the box, I recommend it to everyone today!SpringBoot actual e-commerce project mall (50k+star) address: https://github.com/macrozheng/mall
Introduction
Metabase is a simple and fast BI (data visualization) tool. It has 27k+Star on Github, which shows that it is very popular.
Metabase has the following features:
- It is very fast to build with Docker, and the build and setup can be completed in 5 minutes;
- A data visualization tool available to everyone, you don't need to know SQL;
- Provides a rich dashboard interface, a true online tool, and supports automatic data refresh;
- Support custom SQL query, suitable for people who understand SQL;
- Powerful data pivot function, which can automatically generate dashboards based on data;
- The association analysis of multi-table data can be performed, and there is no need to write SQL.
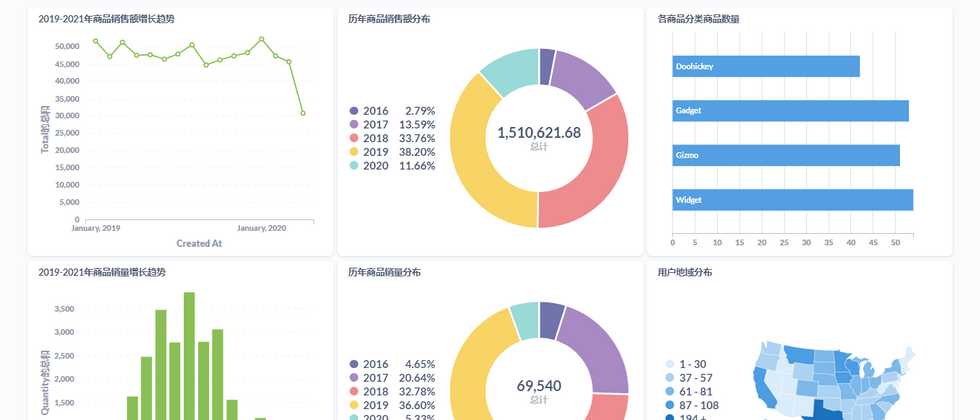
Below is a dashboard generated by Metabase, which is quite cool.

Install
Installing Metabase with Docker is very simple, and we will install it in this way below.
- First download the Docker image of Metabase, only
400Msize, very small;
docker pull metabase/metabase- Next, run the Metabase service with the following command;
docker run -p 3000:3000 --name metabase \
-v /mydata/metabase-data:/metabase-data \
-e "MB_DB_FILE=/metabase-data/metabase.db" \
-d metabase/metabase- During the running process, you can use the following command to view the log;
docker logs -f metabase- From the log, we can easily see that Metabase is an artifact developed in Java. When the following log is output, it means that the startup was successful.

- Finally, open the
3000port of the firewall for external access.
firewall-cmd --zone=public --add-port=3000/tcp --permanent
firewall-cmd --reload
configure
Before using Metabase, we also need some configuration.
- First visit Metabase through the following address, there is a welcome interface, visit the address: http://192.168.3.105:3000/

- Then choose the language, the internationalization of Metabase is still very good, and it supports many languages;

- Next, create an administrator account;

- Then select the database, the types of databases supported by Metabase are also quite rich;

- Configure database connection information;

- Choose whether to allow anonymous collection of usage events;

- After the setting is completed, you can enter the main interface of Metabase.

use
Metabase has a built-in H2 database, which contains some sample data. Let's use this data to demonstrate its basic use.
- First, let's open the sample database to see what data is in it, basically the data tables of orders, commodities, and users;

- We open the
Orderstable to view the data in the table;

- In Metabase, a visual chart is called the
problem. Let's make a2019-2020 commodity sales growth trend chart, first set the filter condition toCreated Atfilter;

- Then make condition settings and add filters;

- Then through the
aggregation function, set the aggregation condition to>Total;

- Then set the grouping condition to
Created At, and group by month;

- After that, a trend line chart will be generated. Through the
visualization button in the lower left corner, we can switch the chart;

lot of supported charts, and finally click the 161e6263a03558 save button to save;

- We can also create a dashboard
plus button at the top;

- Then add the charts to the dashboard, and the sales kanban of
e-commerce platform is completed.

advanced
The function of Metabase is far more than that. Let's introduce some advanced usage of it.
pivot table
Pivot is a very magical function. When we get a bunch of data and don’t know how to analyze it, we can use it to automatically generate various charts for us, and maybe we will get the results you want.
- Let's take a look at the
Orderstable and click the lightning button to use it;

- At this time, Metabase will automatically generate a dashboard to analyze some data, such as the total order volume, the sales volume of each product, and the sales volume of each product category. You can find the data you are interested in;

- Click the zoom button on the right to conduct a more refined analysis based on conditions, such as time. Here, various conditions of the order are analyzed according to the time dimension.

Customize the homepage
Through the tagging function, we can pin the content of interest to the home page.
- For example, if we are interested in the previous
e-commerce platform sales kanban, we can mark it;

- After the marking is completed, it can be easily viewed on the home page.

Custom SQL query
Sometimes the data we analyze is more complex and can be implemented by custom SQL.
- You can click the
Create Question button, and then create anative query;

- Then select the database and enter the custom SQL to query.

data table association
Sometimes when we perform data analysis, we need data from multiple tables. At this time, we can use the data table association function, which can be achieved without handwritten SQL.
- For example, we want
to count the sales of commodities by category. The category information is in theProductstable, and the sales information is in theOrderstable. We can display the editorto select theassociated function;

- Then manage the
Orderstable and theProductstable, and then sum the sales volume and group them by commodity classification to achieve;

- Next, we can see the sales statistics chart of each product by category.

Administrator settings
Through the administrator setting function, we can modify the system settings of Metabase, such as language settings, user management, database management, etc.
- Click
Settings->Administrator to switch to the administrator for settings;

- In the
setting, we can make some basic settings;

- User management is available in
personnel;

- The connection information of each database can be managed in the
data source. The sample data we have been using before is stored in theH2database;

- Permission management can be performed in the
permission.

Summarize
I experienced a Metabase today. It is indeed a good tool out of the box. It only takes 5 minutes to set up. The charts generated by Metabase are also very beautiful and easy to use, and there is no need for handwritten SQL for multi-table analysis. If you have data visualization needs, give it a try!
References
- Project address: https://github.com/metabase/metabase
- Official documentation: https://www.metabase.com/docs/latest/
This article https://github.com/macrozheng/mall-learning , welcome to Star!


**粗体** _斜体_ [链接](http://example.com) `代码` - 列表 > 引用。你还可以使用@来通知其他用户。