Data Visualization Data Visualization Tool Recommendations
The feasibility of building a company-level visualization library/tool from 0 within the R&D team is very low (whether it is cost or whether it has capabilities, etc...). To sum up, today I recommend some existing tools in the web direction (including implementation outlines) , technical direction) for your reference.
All links below are source code repositories.
Like Favorites Don't worry about the trouble of not finding the library for data visualization .
- d3 - JavaScript visualization library for HTML and SVG.
- metrics-graphics - is a library built on top of D3, optimized for visualization and layout of time series data.
- three.js - JavaScript 3D library.
- Chart.js - Simple HTML5 Chart using Canvas
- paper.js - Vector Graphics – Scriptographer ported to JavaScript and browsers using HTML5 canvas
- fabric.js - JavaScript Canvas library providing both SVG to Cnanvas (Canvas to SVG) parser.
- raphael - JavaScript vector graphics library.
- echarts - javascript provides rich charting and visualization library.
- sigma.js -
JavaScript library dedicated to graphics drawing Version1:canvas+svg Version2 : Webgl+canvas
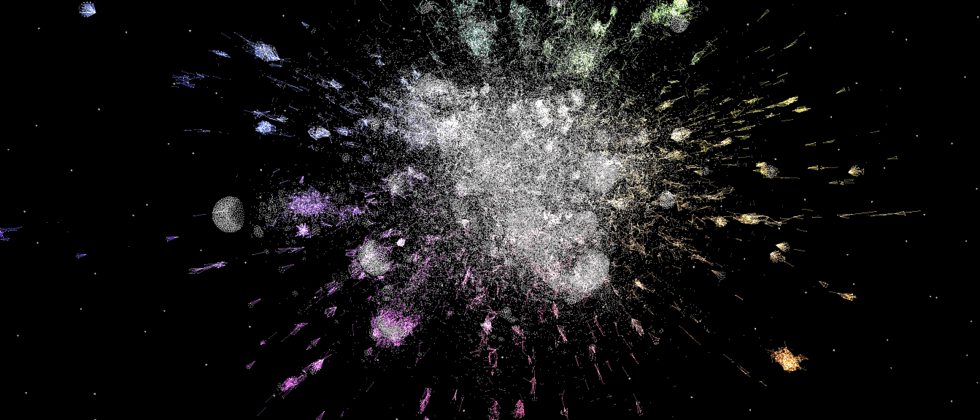
- visjs - Multiple libraries for dynamic, browser-based data visualization. (The screenshot below is network)
- two.js - A renderer-agnostic web 2D drawing API.
- dc.js - Multidimensional chart is a js built for local work with cross filters rendered by d3
- flot - jQuery based JavaScript charts.
- nvd3 - Build reusable charts and chart components js for d3.
- svg.js - Lightweight library for manipulating and animating SVGs.
- dimple.js - Simple business analysis charts powered by d3.
- chartist-js - Simple responsive charts.
- epoch - Generic real-time charting library.
- c3 - D3 based reusable charting library.
- BabylonJS - A framework for building 3D games with HTML5 and WebGL.
- recharts - Redefine charting library with React and D3.
- GraphicsJS - A lightweight JavaScript graphics library based on SVG/VML technology with an intuitive API.
- G2 - is a set of low-level visualization engine based on graph grammar theory, oriented to conventional statistical charts and visual graph grammar.
- G2Plot - A simple, easy-to-use statistical chart library with certain extension and combination capabilities
- Cytoscape.js - A full featured graph theory library.
- cola.js - library for arranging your HTML5 documents and diagrams using constraint-based optimization techniques
- jointjs - Charting library for creating static charts or fully interactive charting tools. (includes free and/paid versions)
- vizzu - Library for animated data visualizations and data stories.
------------------------------------ Network problem without screenshots --------- -----------------------------------
- mxGraph - Diagramming library that enables interactive graph and charting applications to be quickly created that run natively in any major browser that is supported by its vendor.
- Frappe Charts - GitHub-inspired simple and modern SVG charts for the web with zero dependencies.
- Frappe Gantt - A simple, interactive, modern gantt chart library for the web.
- heatmap.js - Heatmap JavaScript library based on HTML5 canvas.
- jquery.sparkline - A plugin for the jQuery JavaScript library to generate small mini-charts directly in the browser.
- d3-cloud - Create word clouds in JavaScript.


**粗体** _斜体_ [链接](http://example.com) `代码` - 列表 > 引用。你还可以使用@来通知其他用户。