Markdown documents are already indispensable in development, but only text descriptions are always a bit boring. When it comes to making charts, you need to switch to other tools, and then paste them back after drawing. If you want to modify, in case the source file is lost, more troublesome. There is actually a way to solve this problem, which is the Mermaid rendering scheme that can be seen in various modern Markdown editors.
Mermaid is a Javascript-based chart drawing tool that can create and dynamically modify charts by parsing Markdown-like text syntax. The main purpose of Mermaid is to allow documentation updates to keep up with development progress.
The charts supported by Mermaid are also very rich: flowcharts, sequence diagrams, class diagrams, state diagrams, entity relationship diagrams, user journey diagrams, Gantt charts, pie charts, requirements diagrams, and Git diagrams.
Take a flowchart as an example to learn how to draw in Markdown.
Example
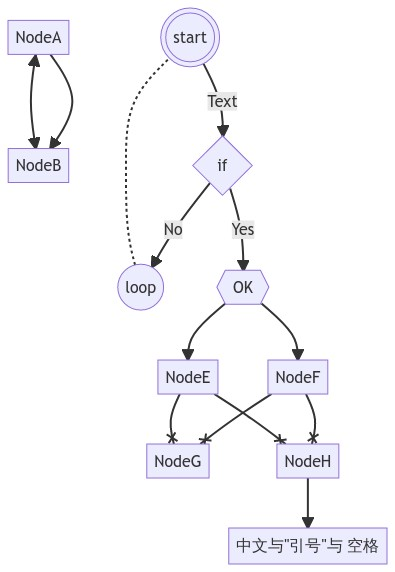
Let's take a look first (official online editor address: Online FlowChart & Diagrams Editor ):
 flowchart TD
    NodeA
    NodeB[NodeB]
    NodeA --> NodeB
    NodeA <--> NodeB
    NodeC(((start))) --Text--> NodeD{if}
    NodeD -->|No| NodeN((loop)) -..- NodeC
    NodeD -->|Yes| NodeY{{OK}}
    NodeY --> NodeF & NodeE --x NodeG & NodeH
    NodeH --> NodeI["中文与#quot;引号#quot;与 空格"]
After rendering it looks like this:
Basic grammar
Since it is drawing in Markdown, the grammar is definitely essential, but don't be afraid, the flow chart is relatively simple and easy to learn.
As with Markdown code blocks, use the backtick syntax to fill in mermaid to mark the beginning of the code area for the drawing and close it with three backticks.
The first line of the flowchart should start with flowchart , indicating that it is a flowchart.
Flowchart direction
Add a space after flowchart to pass in parameters and define the flow chart direction.
| parameter value | TB | TD | BT | RL | LR |
| illustrate | top to bottom | top to bottom | bottom to top | right to left | left to right |
In the example flowchart TD is the identification from top to bottom.
node
Node: Any character entered on each line will be recognized as a new node. The entered character will be used as the node ID and will be displayed as the node name by default. The default shape is a rectangle.
shape
In addition to the rectangle, there are various shapes to choose from, just add a symbol pair after the node. As in the example NodeB[NodeB] , which is a rectangle.
Organized a graphic table:
name
Enter the characters in the shape symbol as the name of the display.
By default, no quotation marks can be used, but if you need to use escape characters or parentheses, you need to wrap them in quotation marks.
For example, the last node in the example NodeI["中文与#quot;引号#quot;与 空格"] , that is, the quote escape character is used.
connecting line
The grammatical structure is roughly: Node ID Link Symbol Node ID ( NodeA <--> NodeB in the example).
If there is no node ID at the end of a line, the first node ID connection of the next line will be found, which means that the syntax of the connection line can be wrapped.
If the node ID does not appear before, it will be treated as a new node. Therefore, the creation and connection of nodes can be written at one time.
Definition of line
The connecting line consists of three characters, the last symbol represents the end point graphics, and the first two symbols represent the style of the line.
To draw a two-way arrow, you need to add a symbol to the head, a total of four characters.
Intermediate symbols can be repeated, and repetitions render longer connecting lines.
For example, in the example NodeA <--> NodeB is a double arrow symbol, the middle represents the shape of a line segment, and the head and tail represent the shape of an arrow.
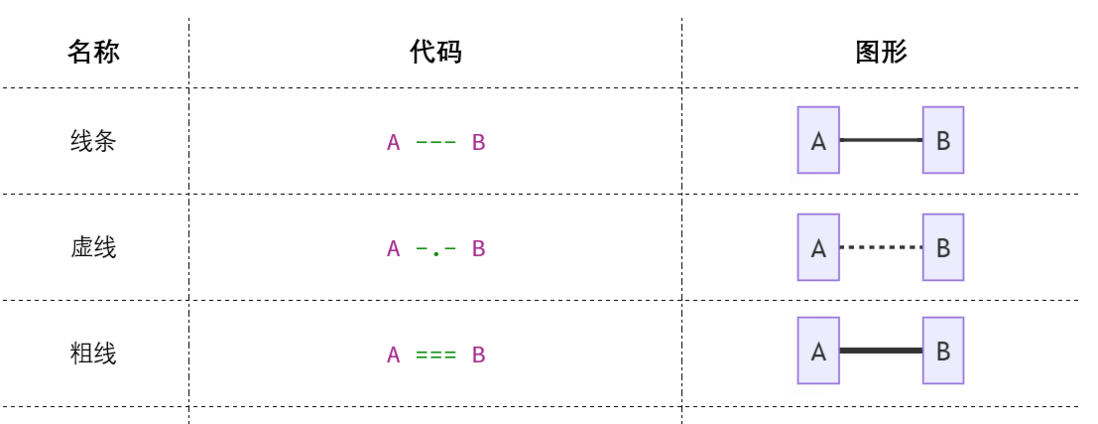
shape of line
There are three types of lines:
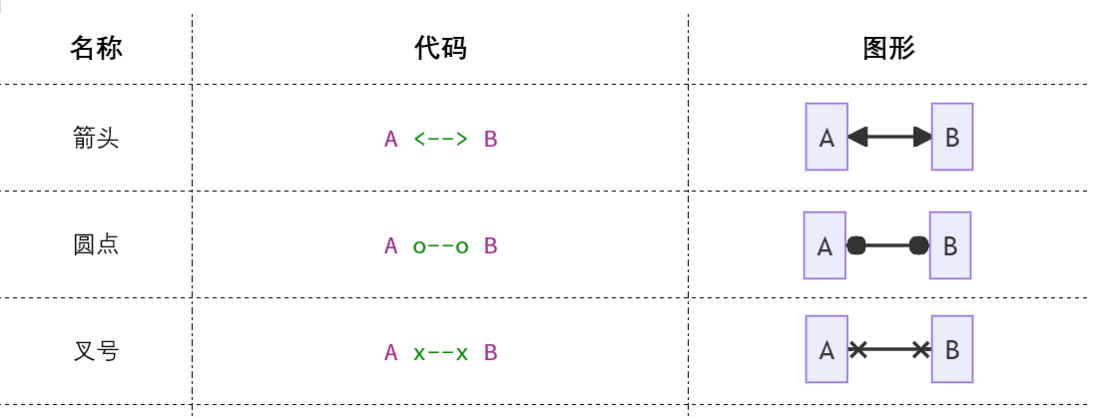
arrow shape
There are also three arrow shapes:
Double arrow:
multiple node connections
& Symbols allow the graph to connect multiple nodes at once:
text annotation
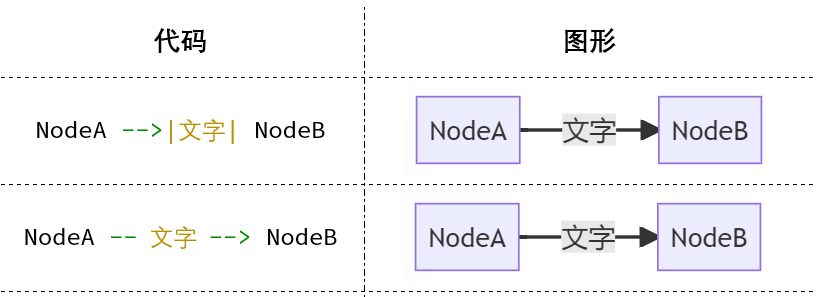
You can add annotations for connecting lines on the connecting lines. There are two ways to write comments:
Write it at the end: || symbol, just add —>|文字| to the end of the connecting line symbol to display.
Written in the middle: similar to —文字—> , -. 文字 .-> , which is equivalent to a repeating connection symbol, the first half is to define the connection line style from the previous graphic to the text, and the second half is to define the text to the graphic Connector style.
It is usually more convenient to write at the end.
Notes
%% is a comment, and it will be regarded as a comment after the symbol until the end of this line.
subgraph (grouping)
The above core concepts have been explained, and the basic drawing is enough. But mermaid can support more than that, such as setting flowcharts in flowcharts, adding events to flowcharts, and using CSS to define flowchart styles. The latter two editors may not be supported, but submaps will be more commonly used.
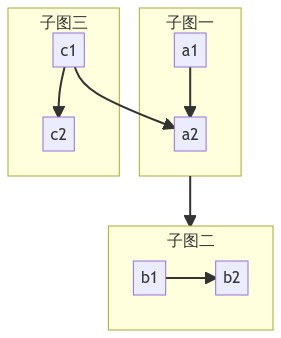
The sub-picture is actually grouping the graphics, adding a background color block, using subgraph ID , end package, the middle picture syntax is the same as before.
subgraph ID Then wrap it in square brackets to define the display name. The elements can be connected arbitrarily, and the connection line between the subgraph and the subgraph can be defined by the subgraph ID.
 flowchart TB
    c1-->a2
    subgraph one [子图一]
    a1-->a2
    end
    subgraph two [子图二]
    b1-->b2
    end
    subgraph three [子图三]
    c1-->c2
    end
    one --> two
Summarize
At this point, the logic of the flow chart is finished. There are many words, but it is not difficult in fact. It is also easy to learn because there are fewer flow chart elements. To sum up at the end.
Node: Any character will be rendered as a node element. The following symbol pairs represent the shape of the graphic, and the middle of the symbol pair represents the graphic display text.
Connection: Use a horizontal line to define a connection. The head and tail of the connection can use different symbols to represent different shapes.
Line text: Use the || symbol or enter text in the middle of the line.
Note: Use %% notation.
Submap: Use subgraph ID and end to wrap, the internal syntax is the same. The elements can be arbitrarily connected.



**粗体** _斜体_ [链接](http://example.com) `代码` - 列表 > 引用。你还可以使用@来通知其他用户。