Data analysts usually need to use programming tools to organize large and complex data and mine useful information in these data. In short, a data analyst is someone who sorts out rules from messy data, and such a job requires a data analyst to master these skills:
Industry knowledge - The foundation of data analysis is to serve the industry. Sufficient industry knowledge allows data analysts to understand what data can provide deeper insights into the industry
Programming skills - Data analysts need to know which libraries should be used to simplify and process data to find what they need
Data Analysis - In addition to their own data analysis capabilities, data analysts also need to know how to use tools to extract value from data
Visualization skills - just extracting data is not enough, data analysts need to organize this data to visualize, summarize and present to others
This article will use Python to run a series of classic data analysis cases online , so that you have a certain understanding of data analysis tools and programming, and use these data to visualize and present the data we have organized.
The data and example code used in the article have been organized into the project file, you can start running and viewing the data online with Python as long as you open it: https://e2f35f8cd0-share.lightly.teamcode.com
analyze data
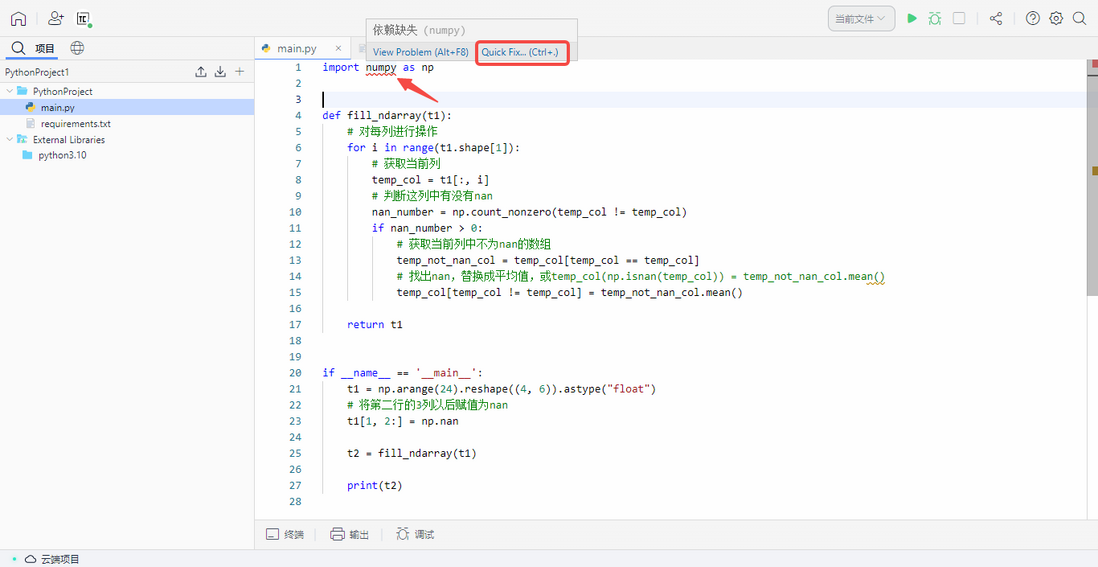
First, we need to use the Pandas library in Python to read the data from the .csv file. If pandas is not installed in your project file, you can refer to the installation tutorial to install it by one-click pip install pandas or Quick Fix.
read data
After installing the Pandas library, we also need to import the Python code import pandas in the editing area, and then read the data file through the following code.
 import pandas as pd
from tabulate import tabulate

df = pd.read_csv('diabetes.csv')
You can use the following code to run it online with Python in the editor and see the effect of the data:
print(tabulate(df, headers = 'keys', tablefmt = 'psql')) As a data analyst, you should know the difference between Numerical and Categorical data.
Numerical data , as the name suggests, refers to data that has numerical meaning. This data has the physical meaning of actual measurements, such as blood sugar, blood pressure, age, etc.
Categorical data describe the nature of the object, such as gender, marital status, hometown, etc. In the data we use this time, only the "results" are actually categorical data. When representing categorical data, we can also use numbers to describe, but these data have no mathematical meaning, you can't use them to do calculations.
data visualization
In this tutorial, we will show a series of data visualizations running online using Python. You can choose the appropriate chart to display according to your data type.
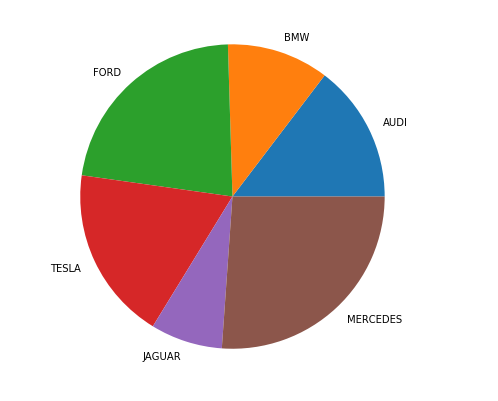
Pie chart
Run the code online using Python : SimplePie.py
Scatter plot
Run the code online using Python : scatterplot.py
line chart
Run the code online using Python : linechart.py
Histogram
Run the code online using Python : multibar.py
After we have finished analyzing the data and visualizing the chart, we can briefly explain the data story based on the data and the content of the chart. For example, there are significantly more people buying Mercedes-Benz than BMW, the proportion of middle-aged and elderly people suffering from diabetes is higher, and the purchase of refrigerators in January is much higher than other months, so continue to analyze based on other data and actual conditions.
Data analysts are also human beings, and we sometimes have some preoccupational concepts when analyzing data. However, the point of the data is to debunk these myths. In the process of analyzing data, we need to keep an open mind and not let biases affect our data results.


**粗体** _斜体_ [链接](http://example.com) `代码` - 列表 > 引用。你还可以使用@来通知其他用户。