tsxecharts
https://github.com/lloydzhou/...
React component wrapper for ECharts based on TypeScript.


项目设计
- 参考vuecharts3对echarts进行封装
- 将echarts官方抽象的
series以及其他的一些组件抽象成为React的组件使用,每一个组件负责管理自己的配置项。 - 这些配置项统一的合并到
Chart画布组件。再统一的通过chart.setOption更新到图表上
安装
yarn add tsxechartsComponents
- 定义一个
Chart组件作为画布 - 将echarts官方配置项每一个配置项使用统一的工厂函数构造成
React Component
DEMO
import 'echarts'
import Echarts from 'vuecharts3'
import { Chart, Line, Bar, Title, Grid, XAxis, YAxis, Tooltip } from 'tsxecharts'

function App() {

  return (
    <div className="App">
      <Chart width={800}>
        <Grid top={100} />
        <Title text="顶部标题" subtext="顶部小标题" left="center" top={10} />
        <Title text="底部标题" top="bottom" left="center" />
        <Bar name="data1" data={[0.32, 0.45, 0.2]} />
        <Bar name="data2" data={[0.2, 0.5, 0.3]} />
        <Line name="data2" data={[0.2, 0.5, 0.3]} />
        <XAxis data={['x1', 'x2', 'x3']} />
        <YAxis />
        <Tooltip trigger="axis" />
      </Chart>
    </div>
  )
}
自定义组件
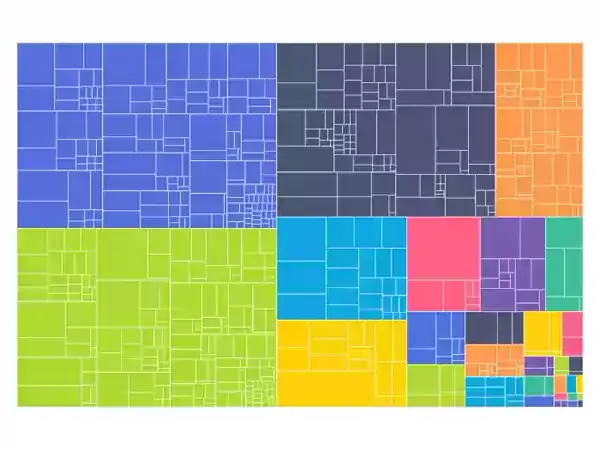
- 通过自定义组件实现官方切换图像的example
function TreemapSunburstTransition() {

  const [type, setType] = useState('')
  const [data, setData] = useState()
  const interval = useRef()
  const id = 'echarts-package-size'

  useEffect(() => {
    const url = "https://fastly.jsdelivr.net/gh/apache/echarts-website@asf-site/examples/data/asset/data/echarts-package-size.json"
    fetch(url).then(res => res.json()).then(data => {
      setData(data.children)
      let type = ''
      console.log('data.value', data.children)
      interval.current && clearInterval(interval.current);
      // @ts-ignore
      interval.current = setInterval(function () {
        setType(type = type === 'treemap' ? 'sunburst' : 'treemap')
        console.log('state.type', type)
      }, 3000);
    })
    return () => interval.current && clearInterval(interval.current)
  }, [])

  if (type === 'treemap') {
    return <Treemap id={id} animationDurationUpdate={1000} roam={false} nodeClick={undefined} data={data} universalTransition label={{show: true}} breadcrumb={{show: false}} />
  }
  return <Sunburst id={id} radius={['20%', '90%']} animationDurationUpdate={1000} nodeClick={undefined} data={data} universalTransition label={{show: false}} itemStyle={{borderWidth: 1, borderColor: 'rgba(255,255,255,.5)'}} />
}


function App() {

  return (
    <div className="App">
      <Chart width={800}>
        <TreemapSunburstTransition />
      </Chart>
    </div>
  )
}


**粗体** _斜体_ [链接](http://example.com) `代码` - 列表 > 引用。你还可以使用@来通知其他用户。