Most articles on time series forecasting focus on a specific degree of aggregation. However, when we can analyze the aggregated data in depth in order to observe the same sequence at a finer-grained level, the challenge arises. In this case, we often find that the lower level forecast is not consistent with the overall forecast. To ensure that this does not happen, we can use a method called Hierarchical Time Series (HTS) forecasting.
Theory Introduction
Let's start with the data. When discussing the time series of aggregation and decomposition, we can distinguish two situations. They can be easily understood by analyzing an example: suppose we are an online retailer, selling different kinds of products in many markets (such as Amazon).
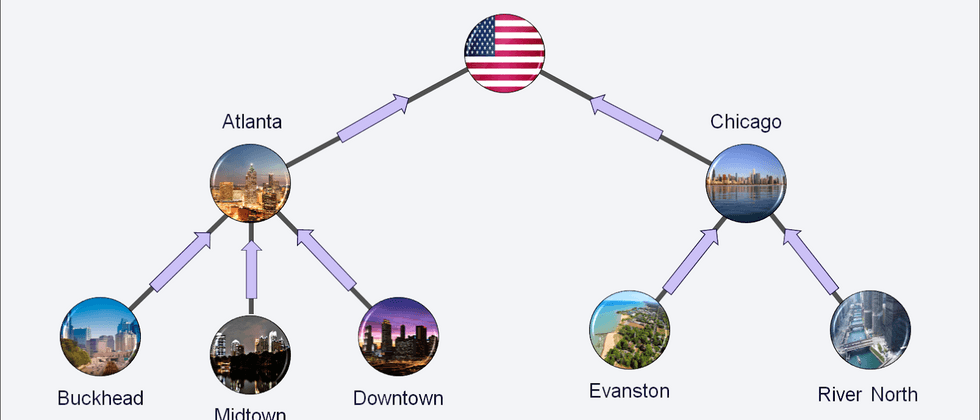
The first case involves a clear hierarchy of data, where lower levels are uniquely nested in higher-level groups. The simplest example is the geographical division. As a retailer, we can view the total sales of all markets and then sort them by country. If necessary, we can study the sales in each region in more depth (such as US states, etc.). When our data follows this structure, we are dealing with hierarchical time series.
The second case involves time series, where all levels are intersected rather than nested. As a retailer, we can have multiple levels of detail: product category, price range, our own products versus products sold by third parties, etc. With such a split, there is no single "correct" way of aggregation. In this case, we use grouped time series.
Of course, when we jointly analyze geographic locations and product categories, the hierarchical and grouped time series can be mixed into a more complex structure.
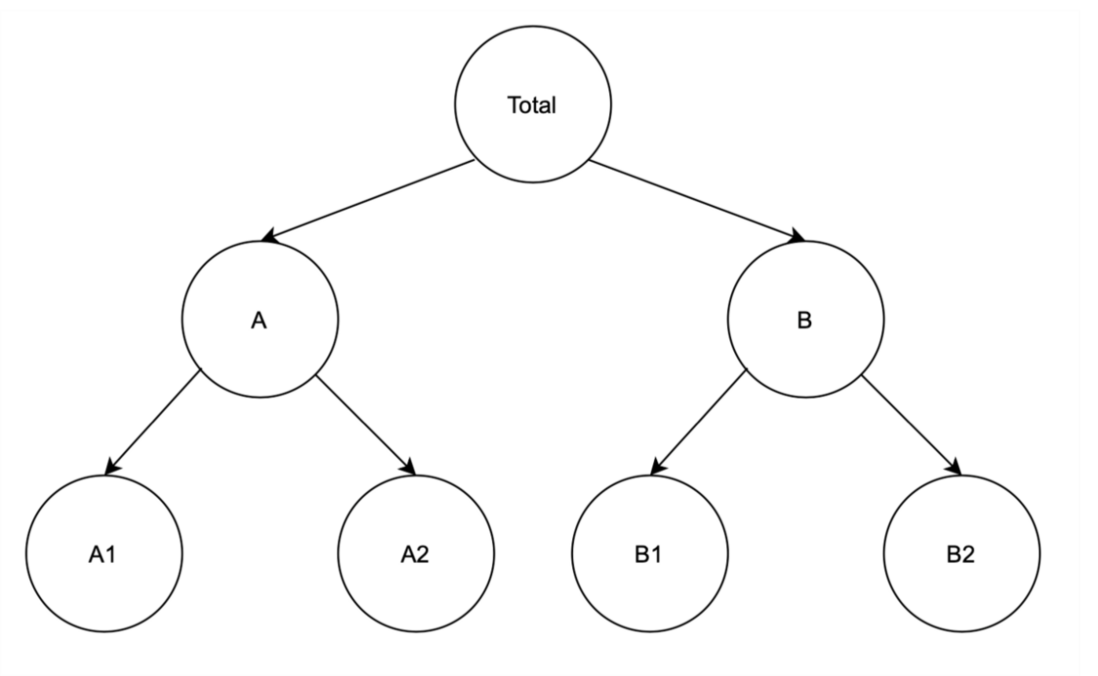
The whole challenge of hierarchical time series forecasting (this name also includes grouping and mixed cases, just to make it clearer) is to generate consistent forecasts for the entire aggregate structure. By coherence, I mean predictions that are accumulated in a manner consistent with the basic aggregation structure. For example, forecasts for all regions should be increased to the national level, all countries should be increased to a higher level, and so on. Or, you can reconcile incoherent forecasts to make them coherent.
Another point to be clarified is that hierarchical time series forecasting is not a time series forecasting method (such as ARIMA, ETS or Prophet). Rather, it is a collection of different technologies that make forecasts consistent in a given personal time series hierarchy.
Below, we will introduce the main methods of time series hierarchical forecasting.
Bottom-up approach
In the bottom-up approach, we predict the finest level of the hierarchy and then aggregate the predictions to create higher-level estimates. Going back to the initial example of an online retailer, we will forecast sales in each region, and then sum these to create a forecast for each country. We can sum up again to get the level of the continent/region, and then finally get the sum.
advantage:
- Since the forecast is obtained at the lowest level, there is no loss of information due to aggregation.
shortcoming:
- The relationship between the sequences (for example, the relationship between different regions) is not considered
- Tends to perform poorly on highly aggregated data
- Computationally intensive (depending on the task and the number of lower levels)
- The greater the noise in the data, the worse the overall accuracy of the forecast
Top-down approach
The top-down approach involves predicting the top level of the hierarchy and then breaking the predictions into more fine-grained sequences. Most commonly, historical proportions are used to determine splits. For example, we can predict the overall level. Then, looking at past data, we can infer that the United States accounted for 50% of sales and Europe accounted for 40%. We can then iterate and decompose the series into more fine-grained levels.
advantage:
- The easiest way
- Predictions at higher levels are reliable
- Only need a forecast
shortcoming:
- Due to the loss of information (through historical proportions), lower-level predictions are less accurate.
Ways to diffuse from it
Diffusion from it is a combination of the above two methods and can only be used for strictly hierarchical time series. In this method, we select the middle layer and directly make predictions. Then, for all levels above the selected level, we use a bottom-up approach-adding up the levels. For the levels below the middle level, we use a top-down approach.
Since this is a compromise between two different methods, the resulting prediction will not lose much information, and the calculation time will not explode like the bottom-up method.
Optimal coordination method
The three methods described above focus on predicting time series at a single level, and then use these to infer the remaining levels. In contrast, in the optimal coordination method, we use all the information and relationships that a given hierarchy can provide to predict each level.
In this method, we assume that the basic prediction (for each level in the sequence of all levels) approximately satisfies the hierarchical structure. This means that the forecast should be relatively accurate, rather than distorting the balance. Then, we use a linear regression model to reconcile the individual predictions. In fact, the coherent forecast is the weighted sum of the basic forecasts at all levels. In order to find the weight, we need to solve a system of equations to ensure that the hierarchical relationship between the different levels is preserved.
advantage:
- More accurate prediction
- Unbiased predictions at all levels with minimal loss of information
- Consider the relationship between time series
- Since each forecast is created independently, this method allows different forecasting methods (ARIMA, ETS, Prophet, etc.) to be used at each level. In addition, different levels can use different feature sets, because some variables may not be available at a given level of granularity.
shortcoming:
- The most complicated method
- Can be computationally intensive-not well suited for a large number of series
in conclusion
In this article, I briefly introduced hierarchical time series forecasting and described the most popular methods used to deal with this challenge. The obvious question is which method to use. As you may have guessed, the answer is: It depends on the situation.
The first three methods tend to be biased towards the level they predict, which makes intuitive sense. Therefore, when getting a certain level of accurate forecast is the most important, we want to get the rest as a by-product, we may want to start with a simpler method and see if we are satisfied.
Otherwise, we might study the best coordination method that tends to be fairly accurate at all levels of the hierarchy. Ideally, we can try all the different methods while using some kind of time series/cross-validation scheme to evaluate the performance of each method and choose the one that best suits us.
Reference
Original author: Eryk Lewinson Translator: Harry Zhu Original English address:
https://towardsdatascience.com/introduction-to-hierarchical-time-series-forecasting-part-i-88a116f2e2As a sharism, all my pictures and texts published on the Internet comply with CC copyright. Please keep the author's information and indicate the FinanceR column of the author Harry Zhu: https://segmentfault.com/blog/harryprince, if it is involved Please indicate the GitHub address for the source code: https://github.com/harryprince. WeChat ID: harryzhustudio
For commercial use, please contact the author.


**粗体** _斜体_ [链接](http://example.com) `代码` - 列表 > 引用。你还可以使用@来通知其他用户。