foreword
For the community (people who follow me, and people who will follow me), there are two things to say in advance:
- I will maintain all the columns created. But the writing cycle makes no promises. Really lazy.. I don't plan to rely on writing to bring me some benefits. (Well, I'm not interested in money)
With the arrival of the Spring Festival, it is also necessary to review the technical architecture design, implementation and future plans led by this year. When it comes to internal privacy, some of the content will be shared here.
Introduction
In 2021, the direction of personal technology can be regarded as a horizontal development, with certain gains. (FastV) the column for one of these directions: a review of the rendering engine 061efae125f1ef. Not open source yet.
Fast means fast, and it is also the original intention of rendering engine design (high-performance experience under big data); V visual (data visual) visualization; FastV fast data visualization, creating a high-performance rendering engine., you can refer to Antv's G2 G6, but the original intention of the design is different, and the advantages of each are different.
The following mainly introduces the rendering library FastV-G developed by one of the basic rendering engines.
Architecture introduction
background
Graph visualization is considered from several aspects: layout (algorithms-layout) rendering (render) interaction (behaviors).
Please see some of the architecture screenshots above (haven't experienced the full design)
The right (blue) illustrates the general idea of the engine:
The controller as the overall controller is divided into render (rendering) events (event/interaction) algorithms (algorithm/logic)
- On the left is the core module, giving a few examples to illustrate our advantages.
1.behaviors high-performance interaction. In fact, the performance of interaction is inseparable from rendering and algorithms. In fact, optimization is also positioning, decomposing, and breaking each. For example, rendering, I did a segmentation for interactive operations. Take the rendering under the BS architecture as an example.
picture shows that the segmentation may be more complicated than the above picture, mainly the idea.
All basic primitives (shapes) are rendered using WebGL (hardware acceleration), and labels are rendered using canvas-2d. Then divide the interactive part into segments. Each update only does the update of the interactive part. How can it be unpleasant. (Of course, the interaction here may have all content updates, and it is also necessary to classify the interaction into different cases)
2.algorithms
The graph algorithm of the Graph algorithm, the data structure of the graph is redesigned, and the advantage of the logical structure is used. For example, array queries are fast. The matrix (array) is used as a graph structure (you can learn a library of C++, ligra, if you are interested, you can share it later) The graph related path algorithm, the community algorithm has made a great improvement. It's almost over.
The layout algorithm of the layout algorithm, such as ForceDirectLyaout (force-guided layout), the underlying data structure of the 2D collision algorithm required for click interaction adopts the quadTree structure to reduce the data set.
- ...Too much
Every detail point of communication is the essence. It can't be said that none of the people here are rivals, but the basic confidence is to kill most of the libraries in terms of performance.
Technology Introduction
BS Technical Selection Instructions
- Webpack project build
- Node & Npm Service Package Management
- Mocha unit tests
- Typescript main program logic
- Canvas WebGL rendering API
- Babel-loader language compilation
P: Algorithm-layout direction, because the algorithms with high complexity are mostly written in C++ (on the one hand, the language problem, on the other hand, considers the scalability problem. The communication problem is not a bottleneck point at present [you can also do segmentation later, have to think]). Communicate in a restful way.
Application scenarios
From the perspective of visualization (interaction), it is divided into three directions: display, analysis, and editing. Then the three directions can also derive various industries. For example, graph analysis:
Graph Analysis
Business areas that FastV-G can support.
- knowledge graph;
- Graph platform: graph database, graph computing;
- safety risk control;
- ...
see the effect
Just sharing the technical results, I don't care about the vision first. Everyone understands hahaha.
- The hardware is i5 CPU with 16G memory
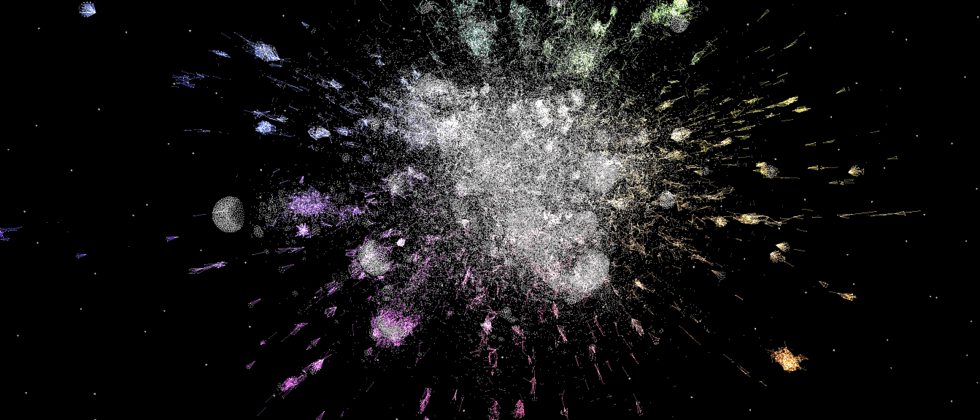
- The algorithm part, about 10w primitives (5w points and 5w sides) The above picture shows the iterative effect within 10s.
- Rendering is done in seconds. Zoom, select and drag related operations are all around 30fps.
At last
First introduce here.over


**粗体** _斜体_ [链接](http://example.com) `代码` - 列表 > 引用。你还可以使用@来通知其他用户。