在这篇文章中将介绍7篇机器学习和深度学习的论文或者图书出版物,这些内容都论文极大地影响了我对该领域的理解,如果你想深入了解机器学习的内容,哪么推荐阅读。
Attention Is All You Need
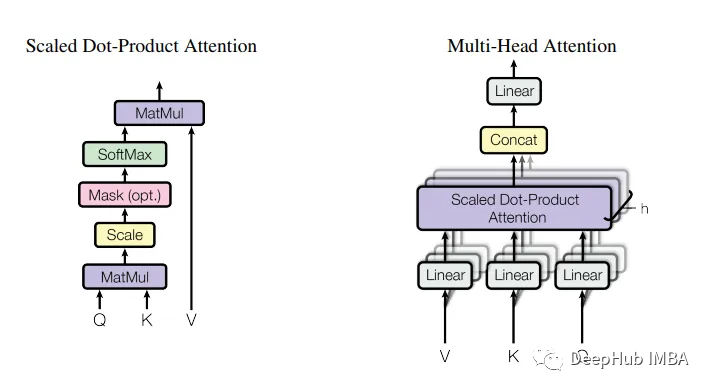
在自然语言处理和序列建模领域,Vaswani等人的一篇论文《Attention Is All You Need》彻底改变了这一领域。这篇开创性的论文介绍了Transformer模型,它仅依赖于注意机制来捕获序列中元素之间的依赖关系。
Transformer模型的注意力机制允许模型在进行预测时专注于输入序列的相关部分,从而在机器翻译、语言生成和其他基于序列的任务中获得令人印象深刻的结果。
作者描述了注意力机制如何使模型能够跨越整个输入序列捕获上下文信息,将长期依赖关系分解为更小、更易于管理的部分。
 import torch
 import torch.nn as nn

 # Implementation of the scaled dot-product attention mechanism
 class SelfAttention(nn.Module):
     def __init__(self, input_dim, hidden_dim):
         super(SelfAttention, self).__init__()
         self.query = nn.Linear(input_dim, hidden_dim)
         self.key = nn.Linear(input_dim, hidden_dim)
         self.value = nn.Linear(input_dim, hidden_dim)
         self.softmax = nn.Softmax(dim=-1)
     def forward(self, x):
         query = self.query(x)
         key = self.key(x)
         value = self.value(x)
         scores = torch.matmul(query, key.transpose(-2, -1))
         attention_weights = self.softmax(scores)
         attended_values = torch.matmul(attention_weights, value)
         return attended_values
这篇论文打开了一个充满可能性的世界,但是他的核心代码就是这么简单。
The Elements of Statistical Learning
由Trevor Hastie, Robert Tibshirani和Jerome Friedman撰写的“the Elements of Statistical learning”。介绍了统计学习的基础知识,并提供了各种机器学习算法的全面概述。阅读这篇论文就像进入了一个隐藏的知识宝库,揭示了预测模型的内部工作原理。
从线性回归到支持向量机,从决策树到深度学习,《the Elements of Statistical learning》涵盖了所有内容。作者熟练地引导读者通过建模揭开复杂概念和算法的面纱。这篇论文不仅提供了必要的工具来建立准确的预测模型,而且还可以拓宽我们对基础数学和理论的理解。
下面就是最简单的线性回归
 from sklearn.linear_model import LinearRegression

 # Linear regression model fitting
 model = LinearRegression()
 model.fit(X_train, y_train)
 # Predicting with the trained model
 y_pred = model.predict(X_test)
Deep Learning
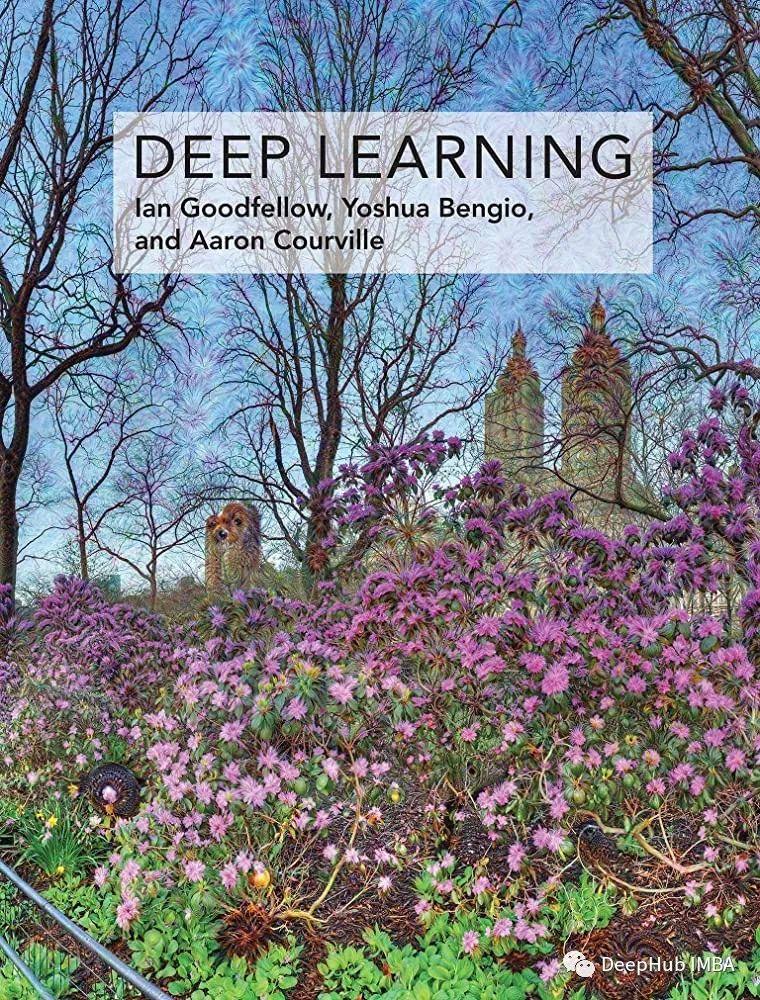
这就是我们常说的 “花书”,Ian Goodfellow, Yoshua Bengio和Aaron Courville的“Deep Learning”绝对是必读的。这本全面的书提供了深度学习的深入探索,揭示了卷积神经网络,循环神经网络和生成模型的奥秘。
深度学习已经彻底改变了我们处理复杂问题的方式,如图像识别、自然语言处理和语音合成。这本书将带你踏上一段迷人的旅程“Deep Learning”使我能够释放神经网络的真正潜力,将我构建智能系统的梦想变为现实。
下面就是使用TF实现的一个最简单的MLP
 import tensorflow as tf
 from tensorflow.keras.models import Sequential
 from tensorflow.keras.layers import Dense

 # Creating a simple neural network using Keras
 model = Sequential()
 model.add(Dense(64, activation='relu', input_shape=(input_dim,)))
 model.add(Dense(1, activation='sigmoid'))
 # Compiling and training the model
 model.compile(optimizer='adam', loss='binary_crossentropy', metrics=['accuracy'])
 model.fit(X_train, y_train, epochs=10, batch_size=32)
A Few Useful Things to Know About Machine Learning for Time Series
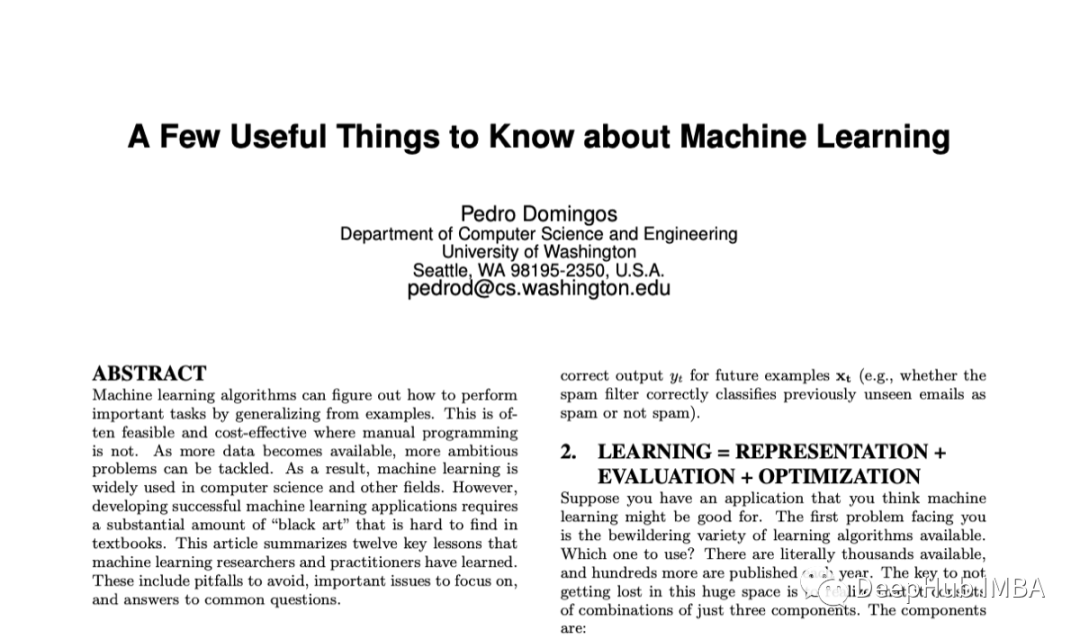
时间序列数据以其独特的特点和挑战在数据科学领域占有特殊的地位。Jean-Paul S. benzacrii的《A Few Useful Things to Know About Machine Learning for Time Series》提供了对建模时间相关数据的复杂性的宝贵见解。这篇论文为我解决时间序列问题打下了坚实的基础,从预测股票价格到预测能源消耗。
作者强调了特征工程和领域知识在时间序列分析中的重要性。了解季节性、趋势分解和自回归综合移动平均(ARIMA)框架对了解时间模式和做出准确预测的探索起到了重要作用。
 from statsmodels.tsa.arima.model import ARIMA

 # Creating and fitting an ARIMA model
 model = ARIMA(data, order=(p, d, q))
 model_fit = model.fit()
 # Making predictions with the fitted model
 predictions = model_fit.predict(start=start_date, end=end_date)
Latent Dirichlet Allocation
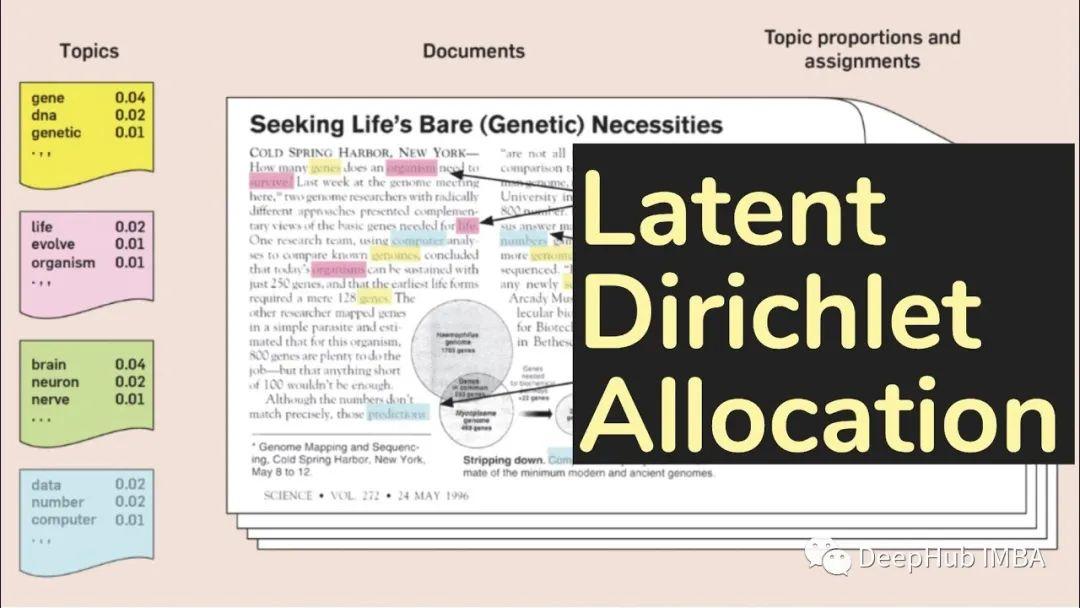
在无监督学习的广阔领域,David M. Blei, Andrew Y. Ng和Michael I. Jordan的“Latent Dirichlet Allocation”是一篇基础论文。这格开创性的工作引入了一个强大的生成概率模型,用于发现文档语料库中的潜在主题。
以下就是使用sklearn实现的LDA代码:
 from sklearn.decomposition import LatentDirichletAllocation

 # Creating and fitting an LDA model
 model = LatentDirichletAllocation(n_components=num_topics)
 model.fit(data)
 # Extracting topic proportions for a document
 topic_proportions = model.transform(document)
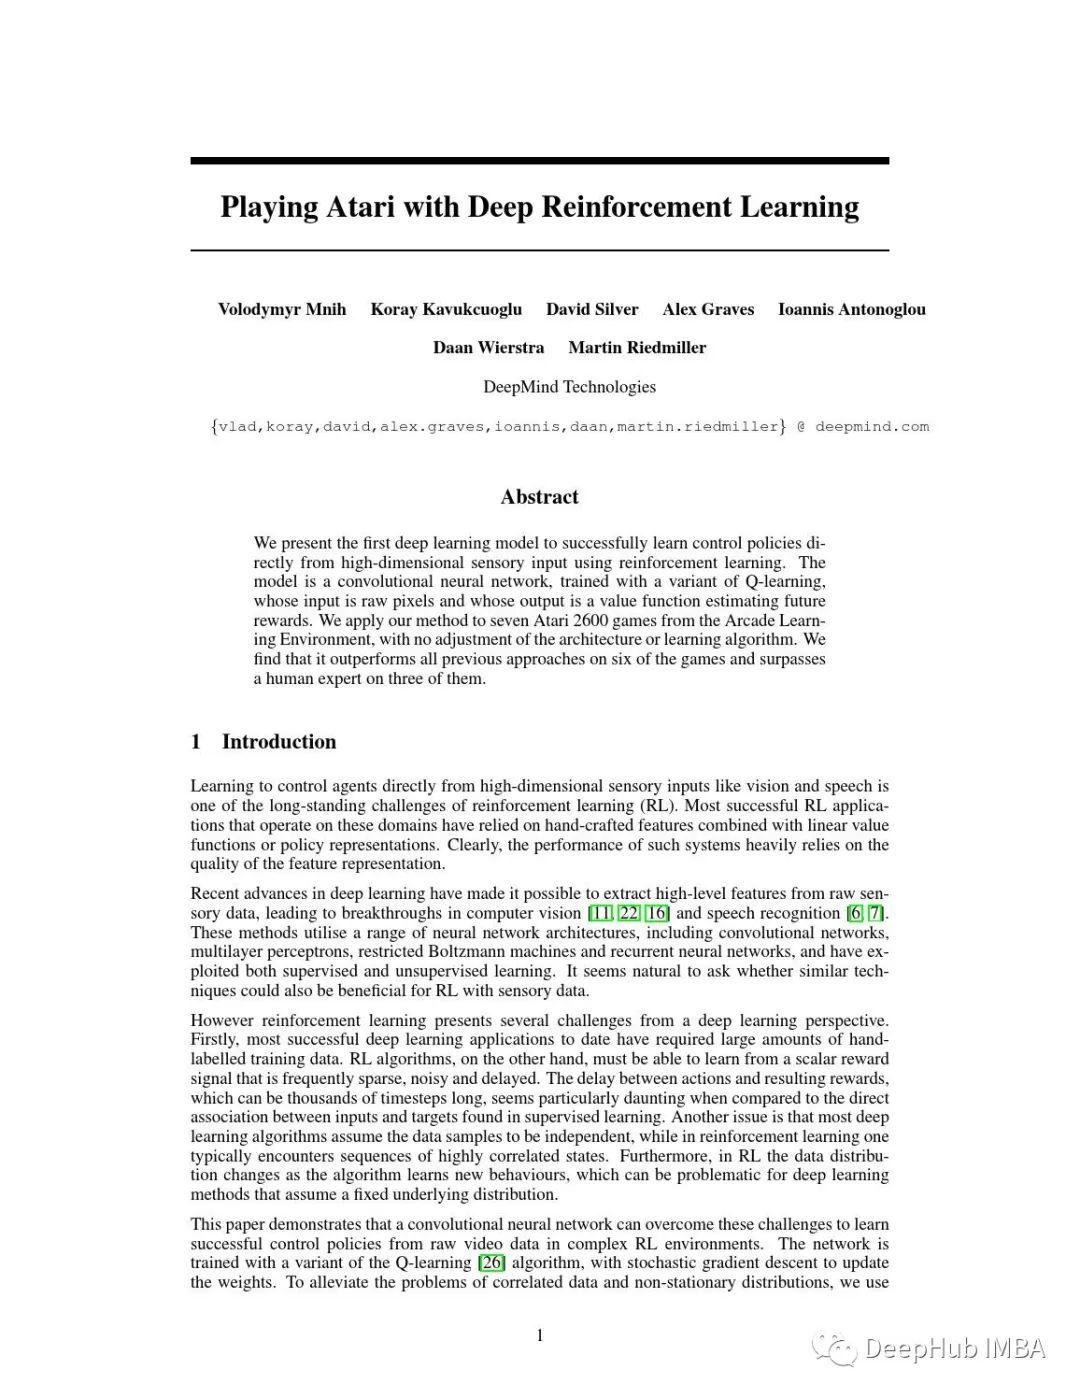
Playing Atari with Deep Reinforcement Learning
强化学习代表了人工智能领域的另外一个研究方向,其应用范围从游戏到机器人。Volodymyr Mnih等人的“Playing Atari with Deep Reinforcement Learning”介绍了一种将深度学习与强化学习相结合的方法.
gym与TF结合也使得深度强化学习更加简单:
 import gym
 import numpy as np
 from tensorflow.keras.models import Sequential
 from tensorflow.keras.layers import Dense

 # Creating a Deep Q-Network for Atari game playing
 model = Sequential()
 model.add(Dense(64, activation='relu', input_shape=(input_dim,)))
 model.add(Dense(num_actions, activation='linear'))
 # Training the DQN agent using the Gym environment
 env = gym.make('Breakout-v0')
 state = env.reset()
 done = False
 while not done:
     action = np.argmax(model.predict(state))
     next_state, reward, done, info = env.step(action)
     state = next_state
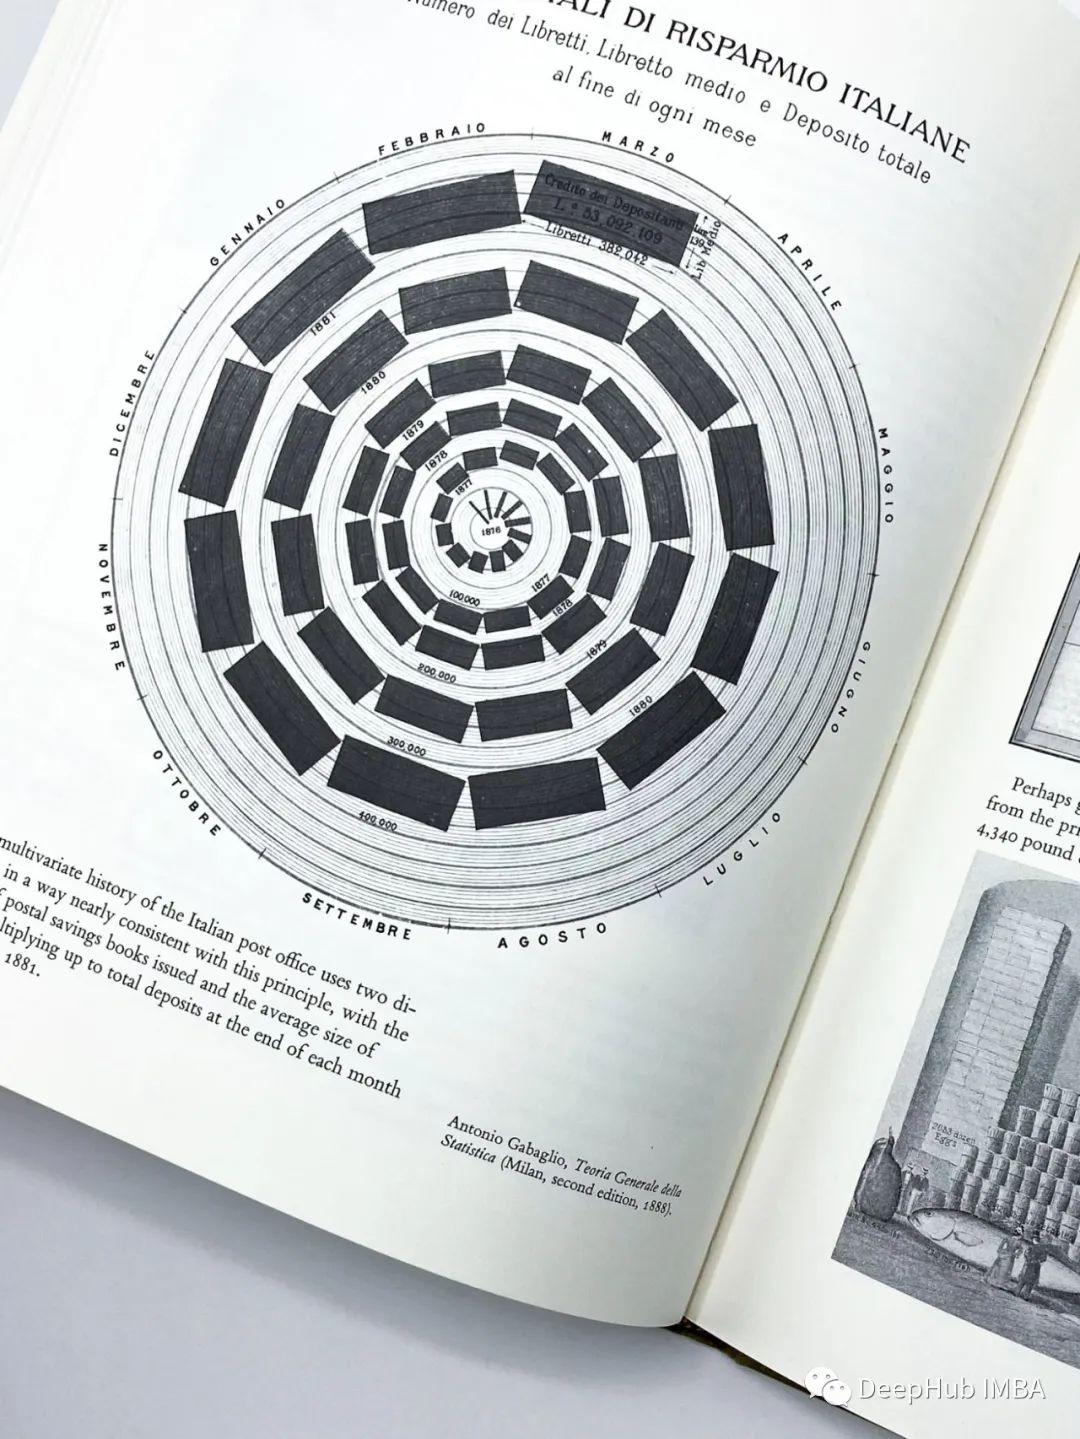
The Visual Display of Quantitative Information
爱德华·r·塔夫特的《The Visual Display of Quantitative Information》。探索了数据可视化的艺术,并为创建有效和信息丰富的视觉显示提供了宝贵的指导。Tufte强调了通过视觉表现清晰沟通的重要性,并教我们如何让数据为自己说话。
Tufte“最大化数据墨水”告诉我们要消除不必要的混乱,专注于以最纯粹的形式呈现数据。这一理念成为了可视化方法的基石。
 import matplotlib.pyplot as plt

 # Scatter plot using the 'matplotlib' library
 plt.scatter(x, y, c='blue', alpha=0.5)
 plt.title("Relationship between X and Y")
 plt.xlabel("X-axis")
 plt.ylabel("Y-axis")
 plt.show()
总结
以上就是我推荐的7篇入门级别的相关读物,这些内容深刻地影响了我们的数据分析、建模和可视化的理解和实践。
https://avoid.overfit.cn/post/2f27526433444e499d39d72b1372ad20
作者 araujogabe1


**粗体** _斜体_ [链接](http://example.com) `代码` - 列表 > 引用。你还可以使用@来通知其他用户。