本篇博文主要介绍一下python中常见的作图方式
线形图
import matplotlib.pyplot as plt
import numpy as np
#生成数据
x = np.arange(0, 10, 0.2)
y = np.sin(x)

# 生成图形
plt.plot(x, y)
plt.show()或者是类似matlab的代码风格,两者结果类似。
# Matlab 风格
from pylab import *
x = arange(0, 10, 0.2)
y = sin(x)
plot(x, y)
show()
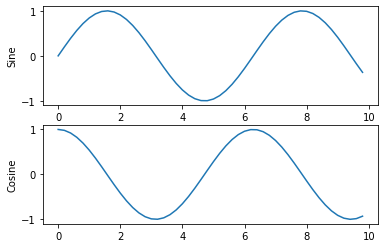
在一个图形中画多张子图,类似于matlab中的subplot函数。
import matplotlib.pyplot as plt
import numpy as np

x = np.arange(0, 10, 0.2)
y = np.sin(x)
z = np.cos(x)

# 在第一个坐标轴上,画上正弦信号
fig, axs = plt.subplots(nrows=2, ncols=1)

axs[0].plot(x, y)
axs[0].set_ylabel('Sine')

# 第二个坐标轴
axs[1].plot(x, z)
axs[1].set_ylabel('Cosine')
plt.show()
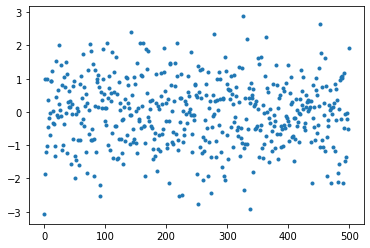
散点图
# 单变量数据
import numpy as np
import matplotlib.pyplot as plt
import pandas as pd
import scipy.stats as stats
import seaborn as sns

# 生成数据
x = np.random.randn(500)

# 绘制图形
plt.plot(x, '.')
plt.show()
# 展示
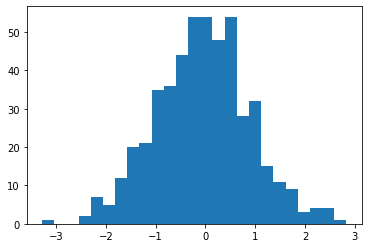
直方图
# 直方图
import numpy as np
import matplotlib.pyplot as plt
import pandas as pd
import scipy.stats as stats
import seaborn as sns

# 生成数据
x = np.random.randn(500)
plt.hist(x, bins=25)
柱形图
import numpy as np
import matplotlib.pyplot as plt
import pandas as pd
import scipy.stats as stats
import seaborn as sns
df = pd.DataFrame(np.random.rand(10, 4), columns=['a', 'b', 'c', 'd'])
df.plot(kind='bar', grid = False)
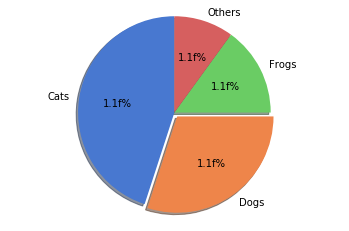
饼图
# 饼图
import seaborn as sns
import matplotlib.pyplot as plt

txtLabels = 'Cats', 'Dogs', 'Frogs', 'Others'
fractions = [45, 30, 15, 10]
offsets = (0, 0.05, 0, 0)
plt.pie(fractions, explode=offsets, labels=txtLabels, autopct='1.1f%%', shadow=True, startangle=90,
       colors=sns.color_palette('muted'))
plt.axis('equal')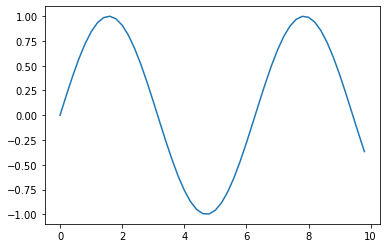

**粗体** _斜体_ [链接](http://example.com) `代码` - 列表 > 引用。你还可以使用@来通知其他用户。