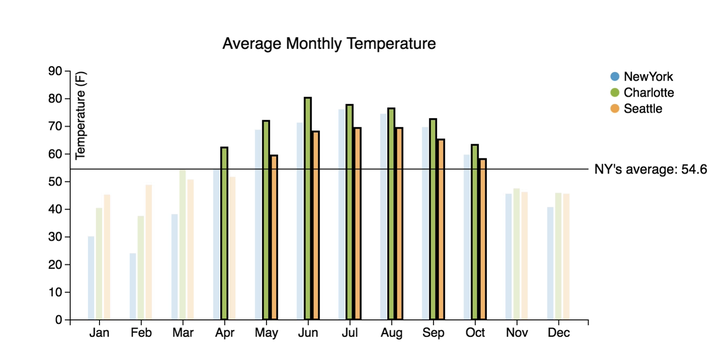
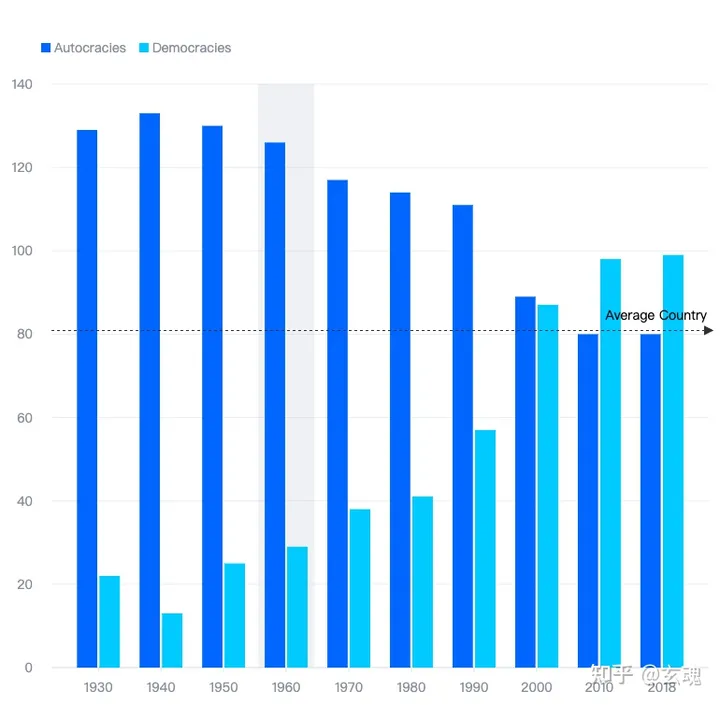
在使用 VChart 图表库时,能否做到类似于下图的效果,在图表中添加标注线表示数据的平均值?
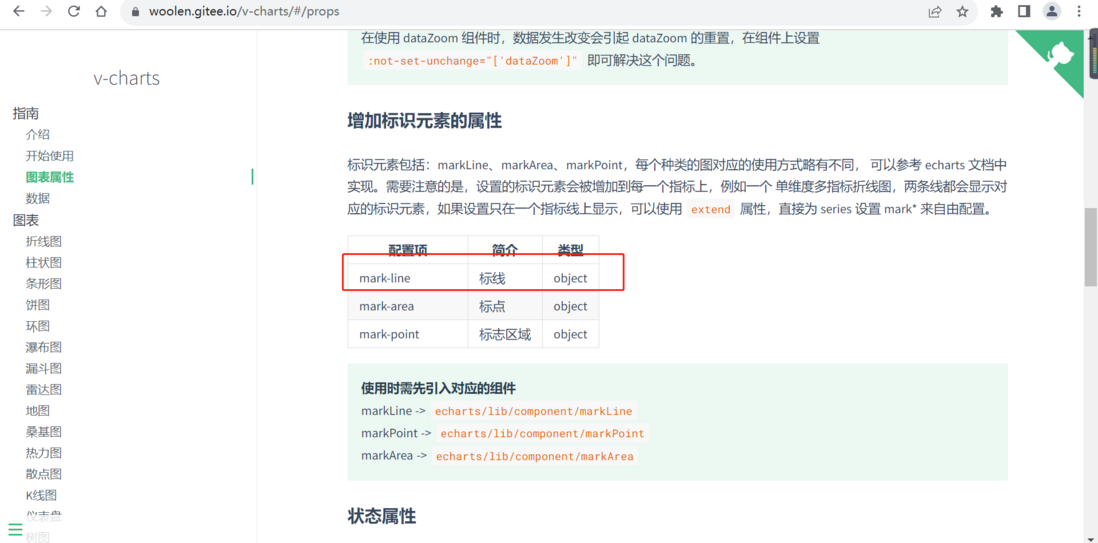
使用markLine
前提是要:
import 'echarts/lib/component/markLine';然后
   markLine: {
        symbol: ['none', 'none'], //去掉两端箭头
        label: {
          //标签
          position: 'insideEndTop'
        },

        lineStyle: { type: 'dotted', color: '#663366' }, //设置标线
        data: [
          {
            type: 'average' //标线的数据类型
          }
        ]
}推荐问题
js 如何将Key属性相同的放在同一个数组?
{代码...} 说明:id和name是动态的,有可能后台返回的是age和school,不是固定id和name想要的结果是; {代码...}13 回答13.1k 阅读
如何防止接口的 key 泄露?
目前有一个小程序,功能上比较简单,但是需要调用其他平台提供的 AI 相关接口。为了节省服务器费用,想直接在前端请求接口,但是这样就会暴露接口的 key。有没有其他办法可以防止 key 泄露? 或者默许 key 可能的泄露,然后实时监控接口的使用量,这种方式是否可行?8 回答3k 阅读
CSS如何让指定的某个Tag不显示(比如:display=none),但是还是占有位置呢?
参考使用:antd的Tag我做了2行的Tag: {代码...} 现在的需求是,如何让指定的某个Tag不显示(比如:display=none),但是还是占有位置呢?3 回答1.4k 阅读✓ 已解决
字节的 trae AI IDE 不支持类似 vscode 的 ssh remote 远程开发怎么办?
尝试一下字节的 trae AI IDE ([链接])安装后导入 vscode 的配置,好像一起把 vscode 的插件也导入了也能看到 vscode 之前配置的 ssh remote 但是连不上看到「输出」如下⬇️ {代码...}2 回答5.3k 阅读✓ 已解决
在购买页面,这里有: for 1 month, for 3 months,这里说的意思是什么呢?
请问:在购买页面,这里有: for 1 month, for 3 months,这里说的意思是什么呢?5 回答1.5k 阅读
请问开发React Native,一般是推荐哪个主流的UI库呢?
请问开发React Native,一般是推荐哪个主流的UI库呢?我们知道React有antd,但是React Native的话好像React Native Mobile RN不是最主流的。3 回答2.4k 阅读✓ 已解决
快开发完的Vue3项目要做SEO该如何处理?
快开发完的Vue3项目要做SEO该如何处理?项目已经快开发完了,领导让做SEO,目前的需求是首页做SEO,其他页面不需要优化去论坛上查了一下,发现好多针对Vue的SEO库都过时弃用了,大家有什么好用的库推荐吗?5 回答1.8k 阅读✓ 已解决


解决方案 Solution
VChart有着丰富的数据标注能力,对于您描绘的场景,只需要在markLine中配置
x: 'average'即可。代码示例 Code Example
在线效果参考:https://codesandbox.io/s/average-markline-wgfdkg

相关文档 Related Documentation
图表标注线demo:https://visactor.io/vchart/demo/marker/mark-line-axis
图表标注教程:https://visactor.io/vchart/guide/tutorial_docs/Chart_Concepts...
相关api:https://visactor.io/vchart/option/barChart#markLine.y
github:https://github.com/VisActor/VChart