请问下,为什么这样写出来后的jsPlumb图表是这个样子的
JS是这样的:
init: function() {
// 初始化流程图配置
jsPlumbToolkit.ready(function () {
// 创建流程菜单
taskConf.createNodePalette(processes);
// ------------------------ toolkit setup ------------------------------------
// 获取相关的dom元素
mainElement = document.querySelector("#jtk-flowchart");
canvasElement = mainElement.querySelector("#jtk-canvas");
controls = mainElement.querySelector("#confControls");
nodePalette = controls.querySelector('#controls-left');
controlsS2 = document.querySelector("#confControls-s2");
// 重置当前点击的连线信息
curSelectedConnection = {};
// 声明一个工具包,提供创建节点,生成id的方法
toolkit = jsPlumbToolkit.newInstance({
idFunction: function (n) {
return n.id;
},
typeFunction: function (n) {
return n.type;
},
nodeFactory: function (typeData, data, callback) {
//typeDatadata 是程序实例对象
data.text = typeData['processName'] + '-' + typeData['programVersion'];
data.processId = typeData['id'];
//data.id = jsPlumbToolkitUtil.uuid();
data.type = typeData['type'];
data.flowId = flowId;
data = flowEvent.addNode(data, callback);
}
});
// ------------------------ / toolkit setup ------------------------------------
// 加载流程图
var flowData = flowEvent.getFlowData(1);
toolkit.clear();
chartInstance = toolkit.load({
data: flowData
});
// ------------------------ rendering呈现 ------------------------------------
// 指导工具包来呈现“画布”的元素。我们通过在一个视图的节点,边缘和港口
// 一起定义渲染器的外观和行为。注意,我们可以有0 - N渲染器
// 分配到工具箱的一个实例。
renderer = window.renderer = chartInstance.render({
container: canvasElement,
view: {
nodes: {
// 开始
start: {template: 'tmplStart'},
// 结束
end: {template: 'tmplEnd'},
// 采集
collect: {template: 'tmpl_1'},
// 适配
adapt: {template: 'tmpl_1'},
// 统计
count: {template: 'tmpl_1'},
// 分析
analyse: {template: 'tmpl_1'}
},
// 定义边缘有两种类型——“default”和“connection”,共享一个共同的父节点。
edges: {
'default': {
anchor: [[0, 0.5, -1, 0], [0.5, -0.1, 0, -1], [1, 0.5, 1, 0], [0.5, 1, 0, 1]],
endpoints: [["Dot", {radius: 3}], ["Dot", {radius: 3}], ["Dot", {radius: 3}], ["Dot", {radius: 3}]],
connector: 'Straight',
paintStyle: {
lineWidth: 2,
strokeStyle: '#61B7CF',
outlineWidth: 10,
outlineColor: 'transparent'
},
hoverPaintStyle: {lineWidth: 2, strokeStyle: 'rgb(33,100,119)'},
events: {
'click': function (params) {
flowEvent.toggleSelectConnector(params, curSelectedConnection);
},
'dblclick': function (params) {
flowEvent.delEdge(params.edge);
}
},
overlays: [
['Arrow', {location: 1, width: 10, length: 10}]
],
reattach: true, // 拖动端点可以解绑并可移动连接到别的节点
allowLoopback: false, //防止环回连接
allowNodeLoopback: false
},
'connection': {
anchor: [[0, 0.5, -1, 0], [0.5, -0.1, 0, -1], [1, 0.5, 1, 0], [0.5, 1.8, 0, 1]],
endpoints: [["Dot", {radius: 3}], ["Dot", {radius: 3}], ["Dot", {radius: 3}], ["Dot", {radius: 3}]],
connector: ['Straight'],
paintStyle: {
lineWidth: 2,
strokeStyle: '#61B7CF',
outlineWidth: 10,
outlineColor: 'transparent'
},
hoverPaintStyle: {lineWidth: 2, strokeStyle: 'rgb(33,100,119)'},
events: {
'click': function (params) {
flowEvent.toggleSelectConnector(params, curSelectedConnection);
},
'dblclick': function (params) {
flowEvent.delEdge(params.edge);
}
},
overlays: [
['Arrow', {location: 1, width: 10, length: 10}]
],
reattach: true, // 拖动端点可以解绑并可移动连接到别的节点
allowLoopback: false, //防止环回连接
allowNodeLoopback: false
},
'connectorSelect': {
parent: 'connection',
paintStyle: {
lineWidth: 2,
strokeStyle: '#EB523E',
outlineWidth: 5,
outlineColor: 'transparent'
}
}
},
// 连接端点类型
ports: {
'start': {
edgeType: 'default',
maxConnections: 1
},
'source': {
maxConnections: 1,
edgeType: 'connection'
},
'target': {
maxConnections: 1,
edgeType: 'connection'
}
}
},
// Layout the nodes using an absolute layout
layout: {
type: 'Absolute'
},
events: {
// 画布点击事件
canvasClick: function (e) {
// 清除选中的节点
toolkit.clearSelection();
// 收起画布左边菜单栏
$('#flowList-dropBtn').hasClass('glyphicon-chevron-up') ? $('#flowList-dropBtn').trigger('click') : '';
},
// 连接节点时触发
edgeAdded: function (params) {
//console.log(params);
},
nodeDropped: function (info) {
//console.log(info);
}
},
lassoInvert: true,
elementsDroppable: true,
consumeRightClick: false,
dragOptions: {
filter: '.node-action, .node-action i'
}
});
renderer.zoomToFit();
// ------------------------ / rendering ------------------------------------
// configure Drawing tools. This is an optional include. 配置绘图工具。这是一个可选的包括。
new jsPlumbToolkit.DrawingTools({
renderer: renderer
});
// ------------------------ drag and drop new tables/views -----------------
/*
在这里,我们注册的元素会下降到工作区,工具箱承认新节点。
typeExtractor:这个函数需要一个元素,并返回jsPlumb代表节点的类型
这个元素。在这个应用程序中,这些信息存储在“jtk-node-type”属性。
dataGenerator:这个函数接受一个节点,并返回一些默认数据类型的节点类型。
*/
var allowDragNodes = nodePalette.querySelectorAll('span.controls-left_icon');
renderer.registerDroppableNodes({
droppables: allowDragNodes,
dragOptions: {
zIndex: 50000,
cursor: 'move',
clone: true
},
typeExtractor: function (el) {
//返回程序实例对象
var processId = el.getAttribute('processId');
return processMap[processId];
},
dataGenerator: function (data) {
//data 是程序实例对象
return {
w: 120,
h: 30,
image: '/admin/etl/taskConf/image/database.svg'
};
}
});
// ------------------------ / drag and drop new tables/views -----------------
// 初始化页面事件
taskConf.initEvents();
sUtils.lockScreen(false);
});
}
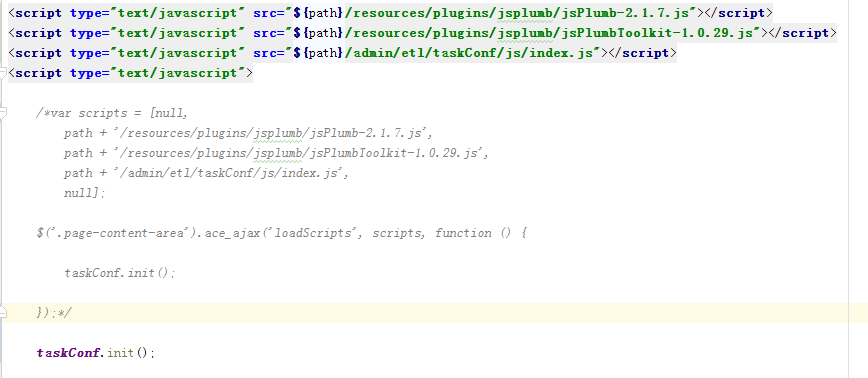
页面调用是这样的:
最后渲染出来的是这样的:
这个时候需要拖动左下角那些线条或者拖动节点之后,连线才能恢复正常位置


找到问题所在:
刚开始点击 A 页面,加载了 A 页面所应用的数据模板,切换到 B 页面的时候,jsPlumb没有加载 B 页面的数据模板,导致在 B 页面中渲染的还是 A 页面的模板,这就出现了异常