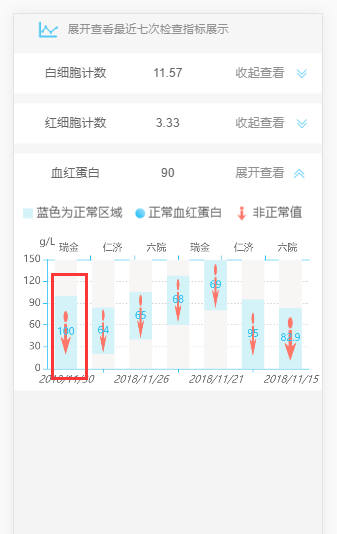
echarts中给series下面的label设置backgroundColor的images大小无效为啥

如图是绘制echarts的代码
myChart.setOption({

            grid: {
                left: '3%',
                right: '4%',
                bottom: '3%',
                containLabel: true
            },
            xAxis: [
                {
                    type : 'category',
                    splitLine: {show:false},
                    data : item.charts.date.map(function(str){
                        return str.replace('-','/')
                    }),
                    axisLine:{
                        lineStyle:{
                            color:'#2EBFF4',
                        }
                    },
                    axisLabel: {
                        textStyle: {
                            color: '#666',//坐标值得具体的颜色
                            fontStyle:'italic'
                        }
                    },
                },
                {
                    type : 'category',
                    splitLine: {show:false},
                    data :item.charts.yy,
                    axisLine:{
                        lineStyle:{
                            color:'#2EBFF4',
                        }
                    },
                    axisLabel: {
                        textStyle: {
                            color: '#666',//坐标值得具体的颜色
                        }
                    },
                }
            ],
            yAxis: {
                name:'g/L',
                nameTextStyle:{
                    color:'#666'
                },
                type : 'value',
                //设置刻度线样式
                splitLine:{
                    show:true,
                    lineStyle:{
                        type:'dotted',
                        color:'#D6D6D6'
                    }
                },
                //设置坐标轴颜色
                axisLine:{
                    lineStyle:{
                        color:'#2EBFF4',
                    }
                },
                axisLabel: {
                    textStyle: {
                        color: '#666',//坐标值得具体的颜色

                    }
                },
            },
            stack: 'component',
            xAxisIndex: 1,
            yAxisIndex: 1,
            itemStyle: {
                normal: {
                    color: '#eee'
                }
            },
            series: [
                { // For shadow
                    type: 'bar',
                    itemStyle: {
                        normal: {color: '#F8F5F5'}
                    },
                    barGap:'-100%',
                    barCategoryGap:'40%',
                    data: dataShadow,
                    animation: false
                },
                {
                    name: '辅助',
                    type: 'bar',
                    stack:  '总量',
                    label:{
                        // backgroundColor:'#D3F3F9'
                    },
                    itemStyle: {
                        normal: {
                            color: '#F8F5F5'
                        },
                    },
                    barGap:'-100%',
                    barCategoryGap:'40%',
                    data: [0, 20, 40, 60, 80, 0]
                },
                {
                    name: '生活费',
                    type: 'bar',
                    stack: '总量',
                    label: {
                        normal: {
                            show: true,
                            position: 'inside',
                            color:'#2EBFF4',
                            verticalAlign: 'middle',
                            // backgroundColor:{
                            //     image:images,
                            //     repeat:'norepeat',
                            //     width:0.5,
                            //     height:0.6
                            // },
                             lineHeight: 56,
                            rich: {
                                b: {
                                    backgroundColor: {
                                        image: images,
                                         height: 10
                                    },
                                    height: 10,
                                    lineHeight:10

                                },
                            }
                        }
                    },
                    itemStyle: {
                        normal: {
                            color: '#D3F3F9'
                        },
                    },
                    data:data,
                }
            ]
        })

效果图如下,想控制这个背景图片的大小改不了,根据echarts给的配置参数设置无用,为啥,求各位大神指教

clipboard.png

阅读 14.5k
4 个回答

问题已解决,可通过series下面的markPoint设置,具体代码如下,详见markPoint
echartsDrawxhdb(e,res,item){

        var that = this
        var images 
        var upimg = this.upImg
        var myChart = this.$echarts.init(e)
        var data=item.charts.value
        var yMax
        if(Math.max.apply(null,item.charts.high)<Math.max.apply(null,item.charts.value)){
            //如果返回参数的最高值小于返回数据的最高值,则y轴的最高值为返回数据的最高值
            
            if(Math.max.apply(null,item.charts.high)<1){
                yMax = Math.max.apply(null,item.charts.value)
            } else {
                yMax = Math.max.apply(null,item.charts.value)
            }
        } else {
            if(Math.max.apply(null,item.charts.high)<1){
                yMax = Math.max.apply(null,item.charts.high)
            } else {
                 yMax = Math.max.apply(null,item.charts.high)
            }
            
        }

        var dataShadow = [];
        var textColor 
        var markPoint = []
        var highData =[]
        var lowData = []
        item.charts.low.map(val=>{
            if(!val){
                Math.min.apply(null,item.charts.value)
            }
        })
        //灰色阴影值处理 最高值-最低值
        item.charts.high.forEach((val,index)=>{
            var value = val-item.charts.low[index]
            highData = highData.concat(value)
        })
        for (var i = 0; i < data.length; i++) {
            dataShadow.push(yMax);
        }
        //定义markpoint里面的颜色
        item.charts.value.forEach((val,index)=>{
            var obj={
                label:{}
            }
            var size 
            if(item.charts.isNormal[index] == 3){
                //偏高
                images = this.upImg
                textColor = '#FF7768'
                size = 15
            } else if(item.charts.isNormal[index] == 4){
                //偏低
                images = this.fallImg
                textColor = '#FF7768'
                size = 15
            } else if(item.charts.isNormal[index] == 1){
                //正常
                images = this.isNormal
                textColor = '#2EBFF4'
                size = 10
            } else {
                images = this.wran
                textColor = '#666'
                size = 10
            }
            obj.coord = [index,val]
            obj.symbol = 'image://'+images
            obj.label.color = textColor
            obj.symbolSize = size
            if(item.charts.isNormal[index] ==3 || item.charts.isNormal[index] ==4 || item.charts.isNormal[index] ==1){
                
            }
            markPoint.push(obj)
        })
        
        var labelOption = {
            normal: {
                show: true,
                rich: {
                    name: {
                        color:'#666'
                    }
                }
            }
        };
        var option = {
            grid: {
                left: '3%',
                right: '4%',
                bottom: '3%',
                containLabel: true
            },
            xAxis: [
                {
                    type : 'category',
                    splitLine: {show:false},
                    data : item.charts.date.map(function(value){
                        return value.replace(/-/g,"/")
                    }),
                    axisLine:{
                        lineStyle:{
                            color:'#666',
                        }
                    },
                    axisLabel: {
                        textStyle: {
                            color: '#666',//坐标值得具体的颜色
                            fontStyle:'italic'
                        }
                    },
                    formatter:function(params){
                    //粘贴以下function内未注释的代码
                    }
                },
                {
                    type : 'category',
                    splitLine: {show:false},
                    data :item.charts.yy.map(function(val){
                        return val
                    }),
                    axisLine:{
                        lineStyle:{
                            color:'#666',
                        }
                    },
                    axisLabel: {
                        textStyle: {
                            color: '#666',//坐标值得具体的颜色
                        },
                        interval:0
                    },
                }
            ],
            yAxis: {
                max:yMax,
                name:'g/L',
                nameGap: 25,
                nameTextStyle:{
                    color:'#666'
                },
                type : 'value',
                //设置刻度线样式
                splitLine:{
                    show:true,
                    lineStyle:{
                        type:'dotted',
                        color:'#D6D6D6'
                    }
                },
                //设置坐标轴颜色
                axisLine:{
                    lineStyle:{
                        color:'#2EBFF4',
                    }
                },
                axisLabel: {
                    textStyle: {
                        color: '#666',//坐标值得具体的颜色

                    }
                },
            },
            stack: 'component',
            xAxisIndex: 1,
            yAxisIndex: 1,
            itemStyle: {
                normal: {
                    color: '#eee'
                }
            },
            series: [
                { // For shadow
                    type: 'bar',
                    itemStyle: {
                        normal: {color: '#F8F5F5'}
                    },
                   // barGap:'-100%',
                    barCategoryGap:'40%',
                    data: dataShadow,
                    animation: false
                },
                {
                    name: '辅助',
                    type: 'bar',
                    stack:  '总量',
                    itemStyle: {
                        normal: {
                            color: '#F8F5F5'
                        },
                    },
                    barGap:'-100%',
                    barCategoryGap:'40%',
                    data: item.charts.low
                },
                {
                    name: '生活费',
                    type: 'bar',
                    stack: '总量',
                    markPoint: { // markLine 也是同理
                        // data: markPoint,
                        data:markPoint,
                        symbolSize:20,
                        label:{
                            show:true,
                            formatter:function(val){
                                return  val.data.coord[1]

                            },
                            position: [0,-30],
                            offset:[0,20]
                        }
                    },
                    itemStyle: {
                        normal: {
                            color: '#D3F3F9'
                        },
                    },
                    data:highData,
                },
            ]
        }
        newline(option,5, 'xAxis')
        myChart.setOption(option,true)
        // myChart.on('click',function(params){
        //     that.showBox(params,item)
        // });
    },

原文档:clipboard.png

{  
    height:10,  //这里设置高度是起作用的
    backgroundColor: {
        image: images,
        height: 10  //这里设置高度是无效的
}
新手上路,请多包涵

请问解决了吗?我也遇到这样的问题了

撰写回答
你尚未登录,登录后可以
  • 和开发者交流问题的细节
  • 关注并接收问题和回答的更新提醒
  • 参与内容的编辑和改进,让解决方法与时俱进
推荐问题