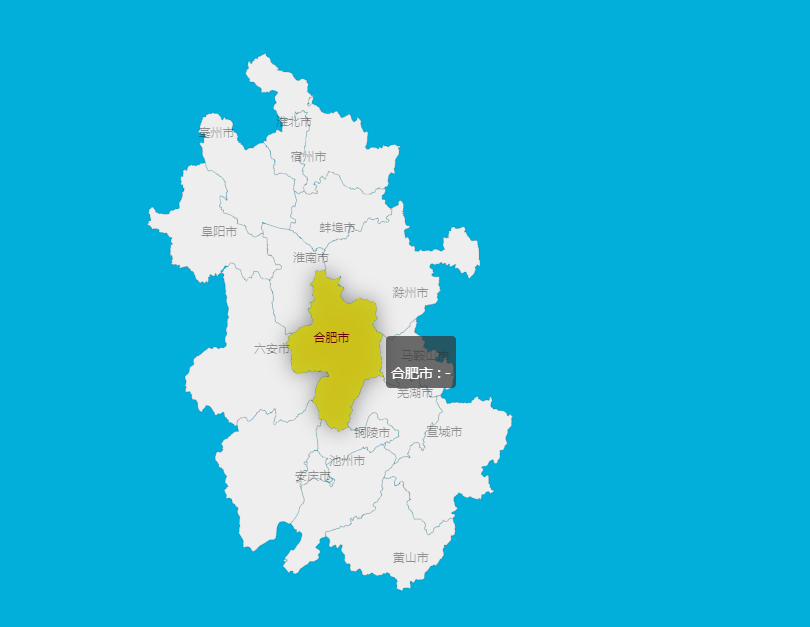
他现在没有值
在data中试了
安徽|合肥,安徽|合肥市,合肥,合肥市,都不管使。这是有特定的格式吗?
本页代码:
<template>
  <div class="xxx">
    <div :style="{ height: '100vh', width: '100%' }" ref="myEchart"></div>
  </div>
</template>
<script>
import echarts from "echarts";
//   import '../../node_modules/echarts/map/js/world.js'
// import "../../node_modules/echarts/map/js/china.js"; // 引入中国地图数据
import "../../node_modules/echarts/map/js/province/anhui.js"; // 引入中国省份数据
export default {
  name: "echarts",
  props: ["userJson"],
  data() {
    return {
      chart: null,
    };
  },
  mounted() {
    this.chinaConfigure();
  },
  beforeDestroy() {
    if (!this.chart) {
      return;
    }
    this.chart.dispose();
    this.chart = null;
  },
  methods: {
    chinaConfigure() {
      console.log(this.userJson);
      let myChart = echarts.init(this.$refs.myEchart); //这里是为了获得容器所在位置
      window.onresize = myChart.resize;
      myChart.setOption({
        // 进行相关配置
        backgroundColor: "#02AFDB",
        tooltip: {}, // 鼠标移到图里面的浮动提示框
        dataRange: {
          show: false,
          min: 0,
          max: 1000,
          text: ["High", "Low"],
          realtime: true,
          calculable: true,
          color: ["orangered", "yellow", "lightskyblue"],
        },
        geo: {
          // 这个是重点配置区
          map: "安徽", // 表示中国地图
          roam: true,
          label: {
            normal: {
              show: true, // 是否显示对应地名
              textStyle: {
                color: "rgba(0,0,0,0.4)",
              },
            },
          },
          itemStyle: {
            normal: {
              borderColor: "rgba(0, 0, 0, 0.2)",
            },
            emphasis: {
              areaColor: null,
              shadowOffsetX: 0,
              shadowOffsetY: 0,
              shadowBlur: 20,
              borderWidth: 0,
              shadowColor: "rgba(0, 0, 0, 0.5)",
            },
          },
        },
        series: [
          {
            type: "scatter",
            coordinateSystem: "geo", // 对应上方配置
          },
          {
            name: "启动次数", // 浮动框的标题
            type: "map",
            geoIndex: 0,
            data: [
              {
                name: "安徽|合肥市",
                value: 599,
              },
              {
                name: "淮南",
                value: 142,
              },
              {
                name: "芜湖",
                value: 44,
              },
              {
                name: "阜阳",
                value: 92,
              },
              {
                name: "黄山",
                value: 810,
              },
              {
                name: "滁州",
                value: 453,
              },
            ],
          },
        ],
      });
    },
  },
};
</script>
