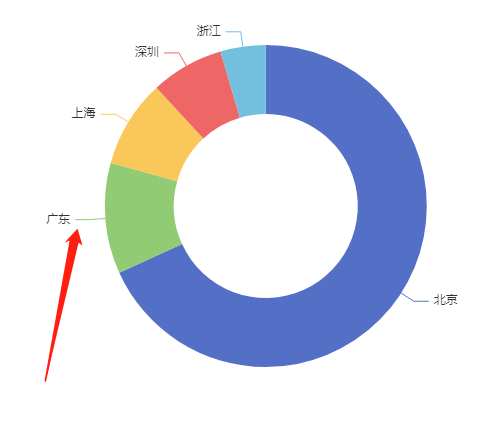
为什么我这个没有
var myChart = echarts.init(document.getElementById('main3'));
          var option = {
              title: {
                  text: '企业数量占比'
              },
              tooltip: {
                trigger: 'item'
              },
              label: {
                  normal: {
                      show: true,
                      position: 'center',
                      formatter: function(data){
                        return data.value+"\n"+"用户数"
                      }
                  },
                  emphasis: {
                      show: true,
                      textStyle: {
                          fontSize: '12',
                          color:"#333"
                      }
                  }
              },
              legend: [
                {
                  orient: 'vertical',
                  x:'65%',
                  y:'center',
                  icon: "circle",
                  textStyle: {
                    fontSize: 16
                  },
                  formatter(name){
                    var data = option.series[0].data;
                    var total = 0;
                    var tarValue;
                    for (var i = 0; i < data.length; i++) {
                      total += data[i].value;
                      if (data[i].name == name) {
                        tarValue = data[i].value;
                      }
                    }
                    var p = Math.round((tarValue / total) * 100);
                    return `${name} | ${p}%`;
                  }
                },
                {
                  orient: 'vertical',
                  icon: "none",
                  x:'90%',
                  y:'center',
                  padding:[0,100,0,0],
                  textStyle: {
                    fontSize: 16,
                    color: '#ccc'
                  },
                  formatter(name) {
                    var data = option.series[0].data;
                    var total = 0;
                    var tarValue;
                    for (var i = 0; i < data.length; i++) {
                      total += data[i].value;
                      if (data[i].name == name) {
                        tarValue = data[i].value;
                      }
                    }
                    var v = tarValue;
                    return `${v}`;
                  }
                }
              ],
              series: [
                {
                  type: 'pie',
                  radius: ['40%', '70%'],
                  avoidLabelOverlap: false,
                  label: {
                      normal: {
                          show: false,
                          position: 'center',
                          formatter: function(data){
                            return data.value+"\n"+data.name
                          },
                          textStyle: { //设置文字样式
                              fontSize: '15',
                              color:"#333"
                          }
                      },
                      emphasis: {
                          show: true, //文字至于中间时,这里需为true
                          textStyle: { //设置文字样式
                              fontSize: '15',
                              color:"#333"
                          }
                      }
                  },
                  center: ["30%", "50%"],
                  itemStyle: {
                    borderWidth: 5,
                    borderColor: 'white'
                  },
                  data: this.ec3
                }
              ]
          }
          myChart.setOption(option);

https://echarts.apache.org/ex...
这个例子左右一对比就看出来了