撰写回答
你尚未登录,登录后可以
- 和开发者交流问题的细节
- 关注并接收问题和回答的更新提醒
- 参与内容的编辑和改进,让解决方法与时俱进
推荐问题
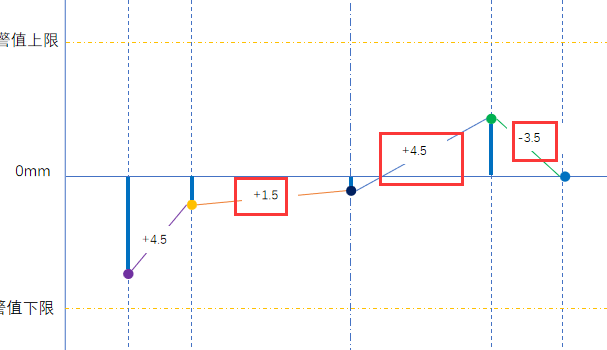
像天气预报一样的地图怎么做?诸位大佬有思路或者案例吗?
要做的效果如图所示:4 回答1.4k 阅读
如何在ECharts中实现阶梯图并显示tooltip?
我需要实现的效果如下,每个metric是单独的一条type line的serie,然后针对于goal line,需要显示成分段式的阶梯图的样子。我尝试使用series type: 'lines'实现可以实现我需要的效果,但是遇到另外一个问题的是tooltip中没有显示goal这个serie,我想在tooltip中显示goal这个serie,请问要如何实现呢?如果没有办法显示ty...1 回答788 阅读✓ 已解决
echart使用datazoom属性不生效?
封装chart组件hook在组件挂载时设置配置项父组件引入chart组件以上是chart组件的封装和使用,哪一步会导致datazoom属性失效呢?4 回答970 阅读
echart堆叠柱形图圆角问题?
echarts里堆叠圆柱体的圆角问题 {代码...} 当上层为0的时候下层不是圆角就不好看了,如何破?下层调为圆角,并不好看2 回答704 阅读✓ 已解决
echart双X轴,怎么使X轴data数据依次从左到右对齐?
如下图,双category X轴,在data中数据长度不一样的情况下,怎么使下面X轴刻度依次从左到右对齐显示1 回答825 阅读✓ 已解决
vue3中引入组件为什么会上浮?
chart\piechart组件结构一样分别在模板中引入chart、piechart组件页面渲染两个组件重叠没有添加任何样式1 回答544 阅读✓ 已解决
tooltip 如何去掉投影?
uniapp 中 echarts 版本5.6.0,折线图设置tooltip 如何去掉投影去掉投影3 回答895 阅读

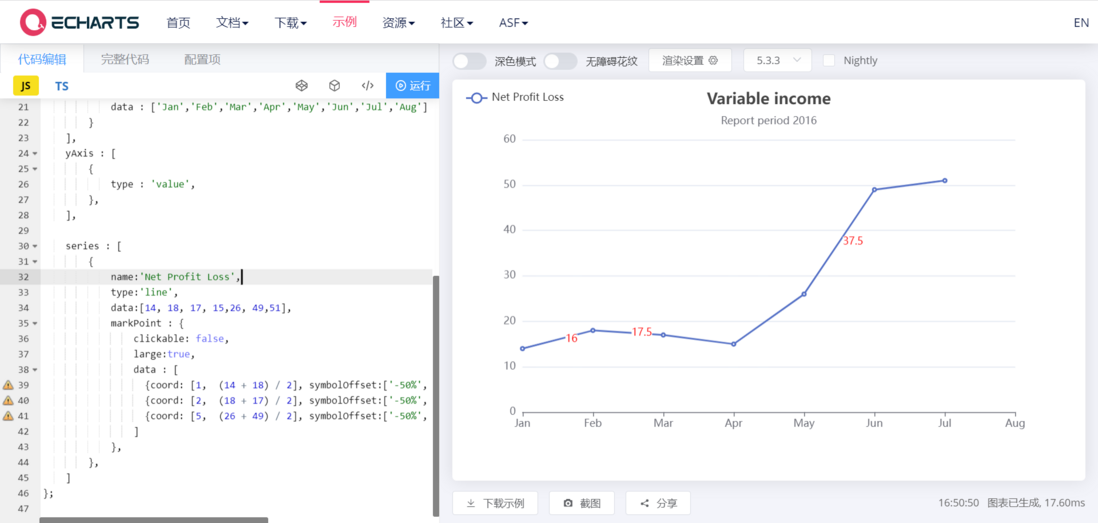
直接用markPoint好了,大概长这样:

代码如下:
希望能帮助到你。