asetSeriesData.push({
                    name: "<span>"+record1000[i+1][1]+"</span>",
                    value: record1000[i+2][1]
                })


                series : [
                            {
                                name: '资产名称',
                                type: 'pie',
                                radius : '60%',//饼图的半径。可以为如下类型:20% 表示外半径为可视区尺寸(容器高宽中较小一项)的 20% 长度
                                center: ['50%', '52%'],//饼图的中心(圆心)坐标,数组的第一项是横坐标,第二项是纵坐标
                                label:{
                                    fontWeight: '100',
                                    normal:{
                                        textStyle:{
                                            fontFamily:'STXihei',
                                            fontSize: '16',
                                            color: 'black',
                                            fontWeight: '200'
                                        },
                                        formatter:"{b}:{d}%"
                                    }
                                },
                                labelLine:{
                                    lineStyle:{
                                        color: 'black'
                                    }
                                },
                                data: asetSeriesData, //数据内容数组
                                itemStyle: {
                                    emphasis: {//高亮的扇区和标签样式。
                                        shadowBlur: 10,
                                        shadowOffsetX: 0,
                                        shadowColor: 'rgba(0, 0, 0, 0.5)'
                                    }
                                }
                            }
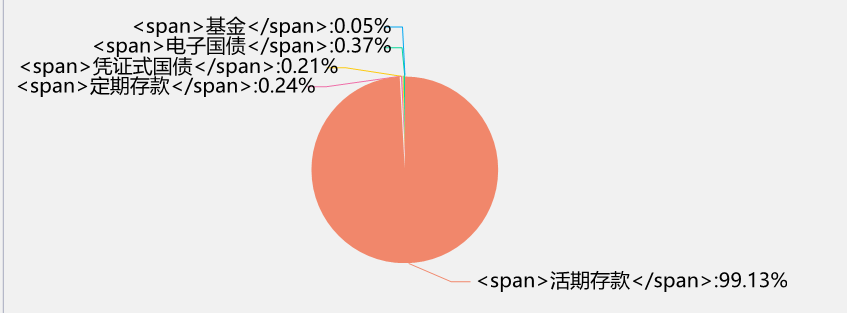
]如图,用了echarts页面为什么不识别html标签?
阅读 3.8k
撰写回答
你尚未登录,登录后可以
- 和开发者交流问题的细节
- 关注并接收问题和回答的更新提醒
- 参与内容的编辑和改进,让解决方法与时俱进
推荐问题
js 如何将Key属性相同的放在同一个数组?
{代码...} 说明:id和name是动态的,有可能后台返回的是age和school,不是固定id和name想要的结果是; {代码...}13 回答12.8k 阅读
Next.js做纯前端是否可行?
最近在学习Next.js存在一个疑问,如果只需要做前端界面的渲染和交互后端逻辑都用java来做,是否还需要使用Next.js,还是说直接使用React+Tailwind css更好7 回答1.9k 阅读
如何实现一个深拷贝函数?
在项目开发中,如何实现一个深拷贝函数?3 回答1.1k 阅读✓ 已解决
git提交记录问题?
"git add .“添加了所有文件.这样导致了项目里每一行代码的修改记录都变成了这次的提交备注"update gitignore"。后续其他同事也提交了几次记录。想着回滚回这次修改以前的,再让同事们重新提交自己的修改。但同事们已经pull过代码,可能也区分不出来了。 有什么方法删除掉gitignore的这次提交,并保留同事们后续的提交?2 回答1.2k 阅读✓ 已解决
body :first-child(不是body:first-child,中间有空格)伪类选择器到底选中了什么元素?
:first-child 选中了什么如题,在学习:first-child伪类的时候,我使用如下语法,但是产生的结果在预料之外。codepen链接html {代码...} css {代码...} 按照:first-child语法,body :first-child选中的应该是body的第一个子元素,也就是 {代码...} 结果选中了这个元素 {代码...} 网上搜索无果,所以来这里提问了,body :f...2 回答870 阅读✓ 已解决
怎么获取动态弹出对话框的模拟单击?
我在用js实现自动化刷课脚本的时候,要处理一个“继续学习”弹出对话框,才能播放。使用document.queryselctor('.continue')获取不到,好像也没有click事件;6 回答897 阅读✓ 已解决
如何实现类似豆包的AI改写框跟随内容滚动效果?
豆包这种是怎么实现的,ai改写这个框是跟随内容滚动的,但是ai改写这个框是在body下与根节点平级的,想了半天,看他页面上代码也看不出来,求助4 回答969 阅读✓ 已解决

Echarts用的canvas来做图,在canvas内,html标签没用的